A quantitative comparison of fve optical coherence tomography angiography systems in clinical performance
Xin-Xin Li1,2,3, Wei Wu4, Hao Zhou1, Jun-Jie Deng1,2,3, Meng-Ya Zhao1,2,3, Tian-Wei Qian1,2,3, Chen Yan1,Xun Xu1,2,3, Su-Qin Yu1
1Department of Ophthalmology, Shanghai General Hospital Affliated to Shanghai Jiao Tong University, Shanghai 200080,China
2Shanghai Key Laboratory of Ocular Fundus Disease,Shanghai 200080, China
3Shanghai Engineering Center for Visual Science and Photomedicine, Shanghai 200080, China
4Department of Mathematics, Eidgenössische Technische Hochschule Zürich, Zurich 8092, Switzerland
Abstract
● AlM:To compare the clinical performance of 4 spectraldomain (SD) optical coherence tomography angiography(OCTA) systems: AngioVueTM, AngioPlexTM, Spectralis®OCTA, AngioScan, and 1 swept-source (SS) OCTA SS OCT AngioTM.
● METHODS:Twenty-seven undilated right eyes of 27 participants underwent OCTA examination using five different systems respectively for both 3×3 and 6×6 mm2scan pattern (Spectralis OCTA for 3×3 mm2scan only).lmage quality, including vessel valid visibility and the number of motion artifacts, and acquisition time were evaluated.Repeated measures analysis of variance (ANOVA) with Bonferroni's post-test and Friedman test with Dunn's posttest were used to compare measurements.
● RESULTS:The age of the subjects was 28.19±5.55y(range, 23-49y).The spherical equivalent refraction was-2.55±1.84 D (range, 0.00 to -5.25 D).Signifcant difference was observed in the evaluation of vessel valid visibility(AngioVue the highest: 0.111±0.031 for 3×3 mm2scan and 0.128±0.020 for 6×6 mm2scan), number of motion artifacts(AngioVue the fewest: 0.778±1.086 for 3×3 mm2scan and 0.333±0.620 for 6×6 mm2scan) and acquisition time(AngioPlex the shortest: 8.537±1.921s for 3×3 mm2scan and 8.298±1.741s for 6×6 mm2scan; allP<0.001).
● CONCLUSlON:There is poor agreement of measurements among systems.AngioVue provides images with the highest vessel valid visibility and the fewest motion artifacts.AngioPlex achieves the shortest acquisition.
● KEYWORDS:optical coherence tomography angiography;devices; vessel valid visibility; motion artifacts; acquisition time
INTRODUCTION
Optical coherence tomography angiography (OCTA) is the most important imaging innovation in ophthalmology in recent years.In order to demonstrate normal and pathologic vascularization, it extracts movement signals from moving particles in blood lumen, which are mainly erythrocytes,by comparing serial optical coherence tomography (OCT)B-scans, and it obtains a numerical value named voxel(portmanteau of “volume” and “pixel”) which estimates the refectivity of tiny loci on a selected region of retina by using different algorithms.OCTA, a three-dimensional functional OCT extension, is then generated based on the aggregation of voxels[1-5].In Fourier domain OCT (FD-OCT) systems,covering spectral domain OCT (SD-OCT), and swept-source OCT (SS-OCT)[6], the OCT signals contain both magnitude and phase information after Fourier transformation.To contrast blood flow, algorithms could be based on phase,magnitude, or both phase and magnitude of OCT signals[7-8].Common OCTA algorithms include phase variance, speckle variance, correlation mapping, complex difference, splitspectrum amplitude decorrelation angiography (SSADA),optical microangiography (OMAG), OCT angiography ratio analysis (OCTARA), full-spectrum probabilistic approach,full-spectrum amplitude-decorrelation angiography (FSADA),phase-resolved doppler OCT (PRD-OCT), and ultra-high speed SS-OCT angiography with VISTA (UHS-OCTA)[9-14].With advances in technology, OCTA shows at least equivalence to dye-injected angiography in showing important vascular detail[15].
Compared to traditional fluorescein angiography, the advantages of OCTA are obvious.It is non-invasive angiography without dye injection, and it is less time-consuming and easier to perform.It could be repeated at any time during follow-up visits, before, and after treatment.The results of OCTA are generally displayed as “en face” frontal sections(C-scans), and it gives the possibility to display and analyze selectively superficial to deep retinal capillary plexuses and choroidal capillaries[8,16].However, OCTA has limitations with recording vascular flling time, detecting vascular leakage, and demonstrating vasculature in the peripheral fields.Patients suffering significant changes in blood composition such as hyperleukocytosis in leukemia may also receive inaccurate OCTA results[17-18].
As the OCTA image is derived from signals generated intrinsically from repeated scans of tissue, image defects and anomalies in visual representations, are known as artifacts.Artifacts have a variety of causes including OCTA image acquisition, intrinsic properties of the eye, eye motion, or image processing and display.Among artifacts, motion artifacts are the most common and easily recognizable,and they appear as end-to-end lines in the axial directions,showing significant difference and poor correlation with neighboring scan lines[5,19].To reduce motion artifacts, a variety of artifacts correction and eye tracking technologies are employed, including Motion Correction Technology (MCTTM),TruTrackTM, FastTracTM, DualTracTM, Real-time SLO Eye HD Tracer, and SMARTTrackTM[11,13,20-23].
Currently, OCTA devices differ from one another.Different manufactures distribute a variety of systems including AngioVueTM(Optovue Inc., Fremont, Calif., USA),AngioPlexTM(Carl Zeiss Meditec Inc., Dublin, Calif., USA),Spectralis®OCTA (Heidelberg Engineering, Heidelberg,Germany), AngioScan (Nidek, Aichi, Japan), and SS OCT AngioTM(Topcon Corporation, Tokyo, Japan)[10-14,23].These systems use different acquisition, saving, and analysis processes.Generally, superficial retinal layer (SRL), deep retinal layer (DRL), outer retinal layer (ORL)/avascular slab,as well as choriocapillaris layer are segmented based on internal limiting membrane (ILM), inner plexiform layer (IPL),outer plexiform layer (OPL), retinal pigment epithelium (RPE),or Bruch’s membrane (BM).Small deviations exist even in default layer segmentation.On account of these differences,the evaluation of OCTA is essential.Several studies have compared different OCTA systems, while certain quantitative methods, which can be widely used, are still lacking[14,19,24].
The aim of our study was to quantitatively compare the clinical performance of five different OCTA systems: AngioVue,AngioPlex, Spectralis OCTA, AngioScan, and SS OCT Angio.We compared them in terms of image quality and acquisition time, in a real-world complete examination.
SUBJECTS AND METHODS
SubjectsIn this cross-sectional study, 27 right eyes of 27 healthy subjects underwent OCTA examination in the Department of Ophthalmology of Shanghai General Hospital Affiliated to Shanghai Jiao Tong University from January 9,2017 to January 31, 2017.This study was approved by the Institutional Review Board and Ethics Committee of Shanghai General Hospital and adhered to the tenets of the Declaration of Helsinki.Written informed consent was obtained from all subjects.
The exclusion criteria are listed as follows: subjects less than 18 years old; best-corrected visual acuity (BCVA) less than 20/20; spherical equivalent refraction less than -6.00 diopters (D)or more than 6.00 D; intraocular pressure more than 21 mm Hg;opacity of refractive media; xerophthalmia; poor fixation and unconsciousness; active and suspected ocular pathology;history of OCTA examination, and history of ophthalmic surgery.Before inclusion, a complete ophthalmologic examination was performed on all eyes, including slit-lamp microscopy (both anterior and posterior segment with dilated pupil), non-contact tonometry and refraction.
Instruments and Scan PatternsTechnical details from AngioVue, AngioPlex, SS OCT Angio, Spectralis OCTA, and AngioScan system are displayed in Figure 1 and Table 1[11-14,23].All eyes were measured without dilation using the all fve of the OCTA systems.The 3×3 and 6×6 mm2images centered on the macula were acquired from each device according to manufacturers' instructions.For Spectralis OCTA, only 3×3 mm2scans were conducted, as it does not offer a 6×6 mm2scan mode on the current version.Operator-determinable settings infuencing evaluations include the following: for AngioVue,MCTTMand DualTracTMremained activated along all of the examination, the 3×3 mm2images had 256×256 A-scans,whereas the 6×6 mm2images used the HD mode of 400×400 A-scans; for AngioPlex, enhanced imaging depth (EDI) mode and FastTracTMwere applied for each test, with 350×350 A-scans in 3×3 mm2images and 256×256 A-scans in 6×6 mm2images; for Spectralis OCTA system, 256×256 A-scans mode was performed, ART and TruTrackTMwere used as well; for AngioScan, the AngioScan4 mode with 256×256 A-scans were employed with the activation of Real-time SLO Eye HD Tracer technology; and for SS OCT Angio, all images employed the 320×320 A-scans mode, while SMARTTrackTMIR tracking technology was enabled at all times.All scans were performed by the same well-trained operator (Zhou H) in the daytime, following manufacturers' guidelines.The sequence of the 5 devices was arranged randomly to avoid methodological bias for each subject, predetermined by Microsoft Offce Excel(Microsoft Corp, Redmond, WA, USA).For each system,3×3 mm2image acquisition was antecedent to 6×6 mm2.Acquisition time were recorded throughout the examination.
Table 1 Technical characteristics of five different OCTA systems
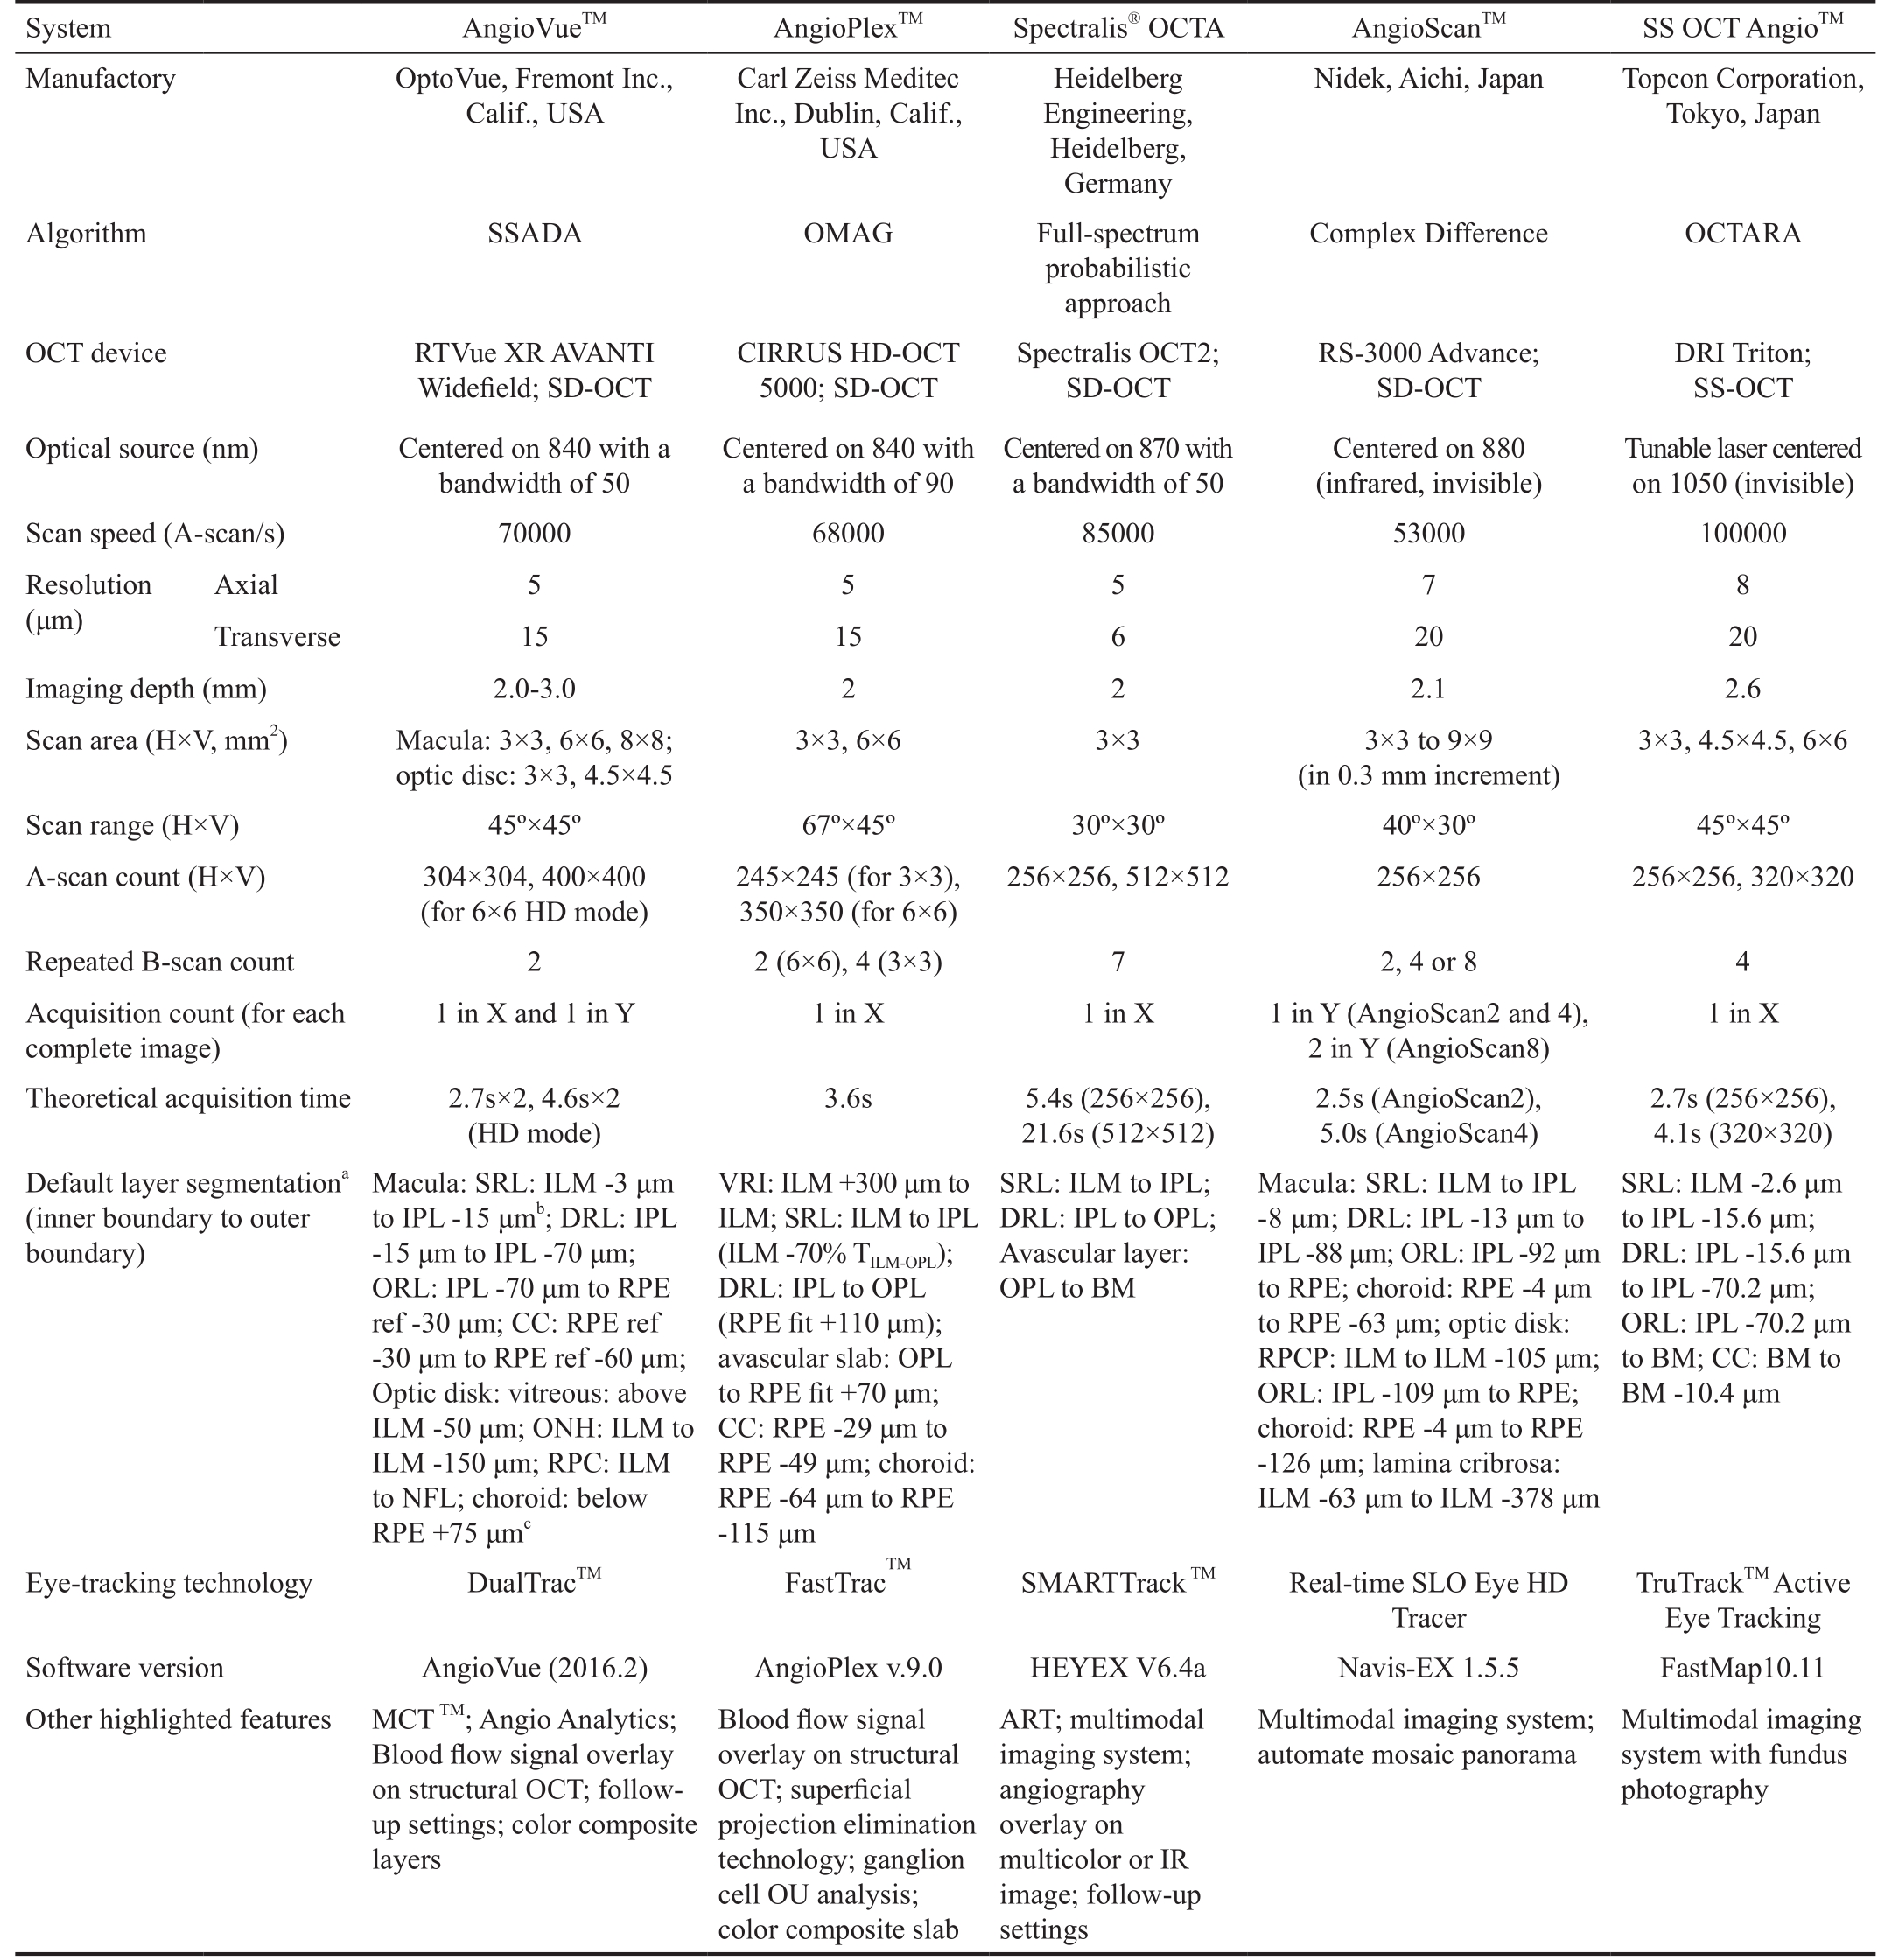
aIn layer segmentation, ILM, IPL, OPL, RPE and BM refer to the loci of their outer boundary respectively;bInferior to;cSuperior to.ART:Automated real-time mode; BM: Bruch’s membrane; CC: Choriocapillaris; DRL: Deep retinal layer; H×V: Horizontal×vertical; HD: High defnition; ILM: Inner limiting membrane; IPL: Inner plexiform layer; IR: Infrared; MCT: Motion correction technology; NFL: Nerve fber layer; N/A: Not applicable; OCT: Optical coherence tomography; OCTA: OCT angiography; OCTARA: OCTA ratio analysis; OMAG: Optic micro-angiography; ONH: Optic nerve head; OPL: Outer plexiform layer; RPC: Radial peripapillary capillary; RPCP: RPC plexus; RPE:Retinal pigment epithelium; SD-OCT: Spectral domain OCT; ORL: Outer retinal layer; SRL: Superfcial retinal layer; SSADA: Split-spectrum amplitude-decorrelation angiography; SS-OCT: Swept source OCT; TILM-OPL: Thickness between ILM and OPL; VRI: Vitreoretinal interface.
System AngioVueTMAngioPlexTMSpectralis®OCTA AngioScanTMSS OCT AngioTMManufactory OptoVue, Fremont Inc.,Calif., USA Carl Zeiss Meditec Inc., Dublin, Calif.,USA Heidelberg Engineering,Heidelberg,Germany Nidek, Aichi, Japan Topcon Corporation,Tokyo, Japan Algorithm SSADA OMAG Full-spectrum probabilistic approach Complex Difference OCTARA OCT device RTVue XR AVANTI Widefeld; SD-OCT DRI Triton;SS-OCT Optical source (nm) Centered on 840 with a bandwidth of 50 CIRRUS HD-OCT 5000; SD-OCT Spectralis OCT2;SD-OCT RS-3000 Advance;SD-OCT Tunable laser centered on 1050 (invisible)Scan speed (A-scan/s) 70000 68000 85000 53000 100000 Resolution(μm)Centered on 840 with a bandwidth of 90 Centered on 870 with a bandwidth of 50 Centered on 880(infrared, invisible)Axial 5 5 5 7 8 Transverse 15 15 6 20 20 Imaging depth (mm) 2.0-3.0 2 2 2.1 2.6 Scan area (H×V, mm2) Macula: 3×3, 6×6, 8×8;optic disc: 3×3, 4.5×4.5 3×3, 6×6 3×3 3×3 to 9×9(in 0.3 mm increment)3×3, 4.5×4.5, 6×6 Scan range (H×V) 45°×45° 67°×45° 30°×30° 40°×30° 45°×45°A-scan count (H×V) 304×304, 400×400(for 6×6 HD mode)245×245 (for 3×3),350×350 (for 6×6)256×256, 512×512 256×256 256×256, 320×320 Repeated B-scan count 2 2 (6×6), 4 (3×3) 7 2, 4 or 8 4 Acquisition count (for each complete image)1 in X and 1 in Y 1 in X 1 in X 1 in Y (AngioScan2 and 4),2 in Y (AngioScan8)1 in X Theoretical acquisition time 2.7s×2, 4.6s×2(HD mode)3.6s 5.4s (256×256),21.6s (512×512)2.5s (AngioScan2),5.0s (AngioScan4)2.7s (256×256),4.1s (320×320)Default layer segmentationa(inner boundary to outer boundary)Macula: SRL: ILM -3 μm to IPL -15 μmb; DRL: IPL-15 μm to IPL -70 μm;ORL: IPL -70 μm to RPE ref -30 μm; CC: RPE ref-30 μm to RPE ref -60 μm;Optic disk: vitreous: above ILM -50 μm; ONH: ILM to ILM -150 μm; RPC: ILM to NFL; choroid: below RPE +75 μmcVRI: ILM +300 μm to ILM; SRL: ILM to IPL(ILM -70% TILM-OPL);DRL: IPL to OPL(RPE ft +110 μm);avascular slab: OPL to RPE ft +70 μm;CC: RPE -29 μm to RPE -49 μm; choroid:RPE -64 μm to RPE-115 μm SRL: ILM to IPL;DRL: IPL to OPL;Avascular layer:OPL to BM Macula: SRL: ILM to IPL-8 μm; DRL: IPL -13 μm to IPL -88 μm; ORL: IPL -92 μm to RPE; choroid: RPE -4 μm to RPE -63 μm; optic disk:RPCP: ILM to ILM -105 μm;ORL: IPL -109 μm to RPE;choroid: RPE -4 μm to RPE-126 μm; lamina cribrosa:ILM -63 μm to ILM -378 μm SRL: ILM -2.6 μm to IPL -15.6 μm;DRL: IPL -15.6 μm to IPL -70.2 μm;ORL: IPL -70.2 μm to BM; CC: BM to BM -10.4 μm Eye-tracking technology DualTracTMFastTracTMSMARTTrackTMReal-time SLO Eye HD Tracer TruTrackTMActive Eye Tracking Software version AngioVue (2016.2) AngioPlex v.9.0 HEYEX V6.4a Navis-EX 1.5.5 FastMap10.11 Other highlighted features MCTTM; Angio Analytics;Blood fow signal overlay on structural OCT; followup settings; color composite layers Blood fow signal overlay on structural OCT; superfcial projection elimination technology; ganglion cell OU analysis;color composite slab ART; multimodal imaging system;angiography overlay on multicolor or IR image; follow-up settings Multimodal imaging system;automate mosaic panorama Multimodal imaging system with fundus photography
Acquisition time was defined as the arithmetic mean time measured by two independent timekeepers (Yan C and Deng JJ) with standard chronometers (iPhone 6, iOS 10.0; Apple,Inc., Cupertino, Calif., USA).In each examination, completed scans were retained for analysis, whereas the uncompleted ones were deleted and repeated.However, when a scan was completed with low signal strength or low-quality[24], repeat acquisition was not performed, as per study protocol.Each subject was instructed to close their eyes for at least 5min and blink completely before each examination.
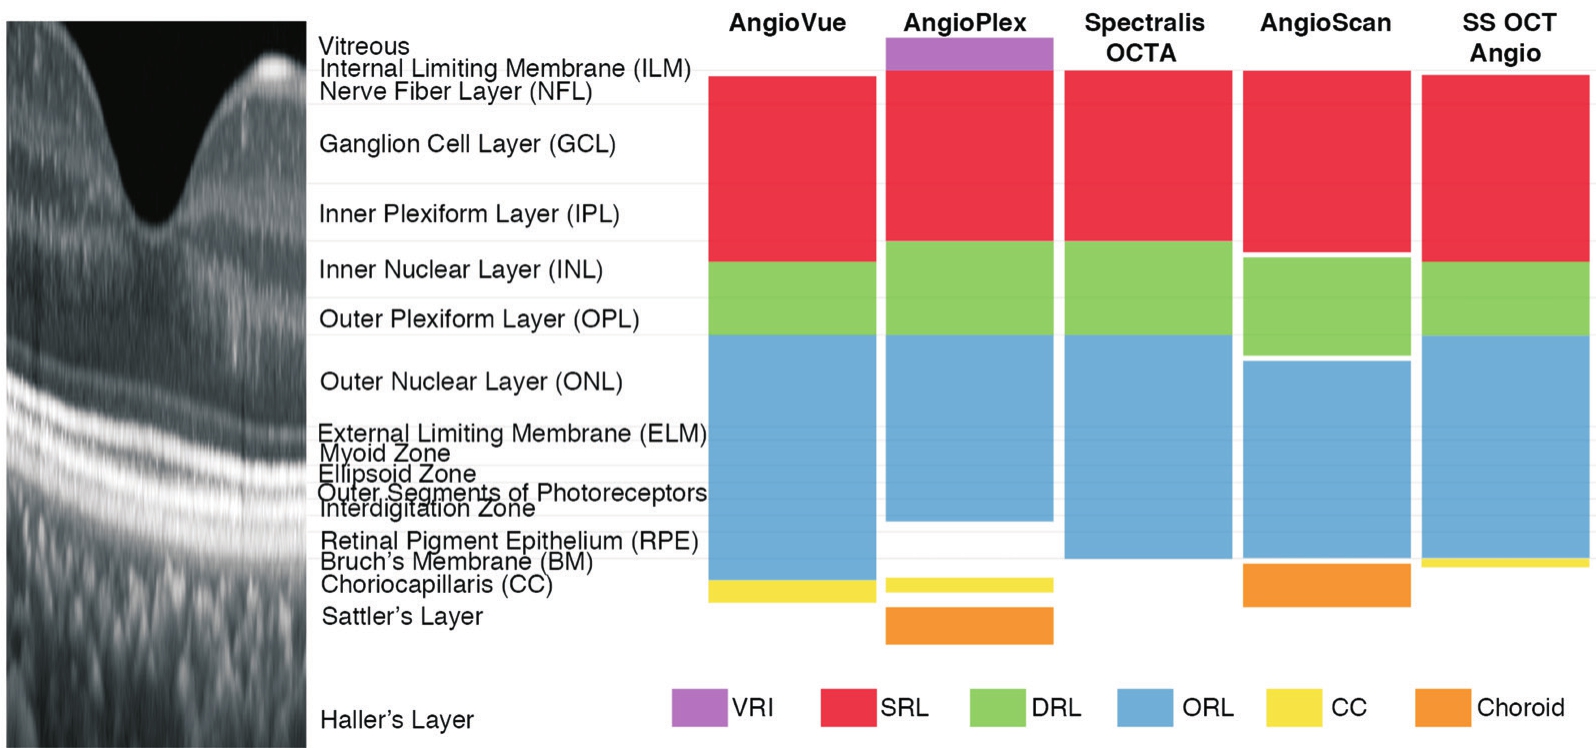
Figure 1 Illustration of default layer segmentation of AngioVue, AngioPlex, Spectralis OCTA, AngioScan, and SS OCT Angio Spectraldomain optical coherence tomography (SD-OCT) image shows the structure of a healthy human retina (aspect ratio 10:1).All fve devices share similar layer defnitions of superfcial retinal layer (SRL; red), deep retinal layer (DRL; green) and outer retinal layer (ORL; blue) in existence of small deviations.Meanwhile, slab defnitions differ greatly at vitreous and choroid level: AngioVue, AngioPlex, and SS OCT Angio segment choriocapillaris (CC; yellow), AngioPlex and AngioScan segment choroid (orange) and AngioPlex segments vitreoretinal interface (VRI; purple).
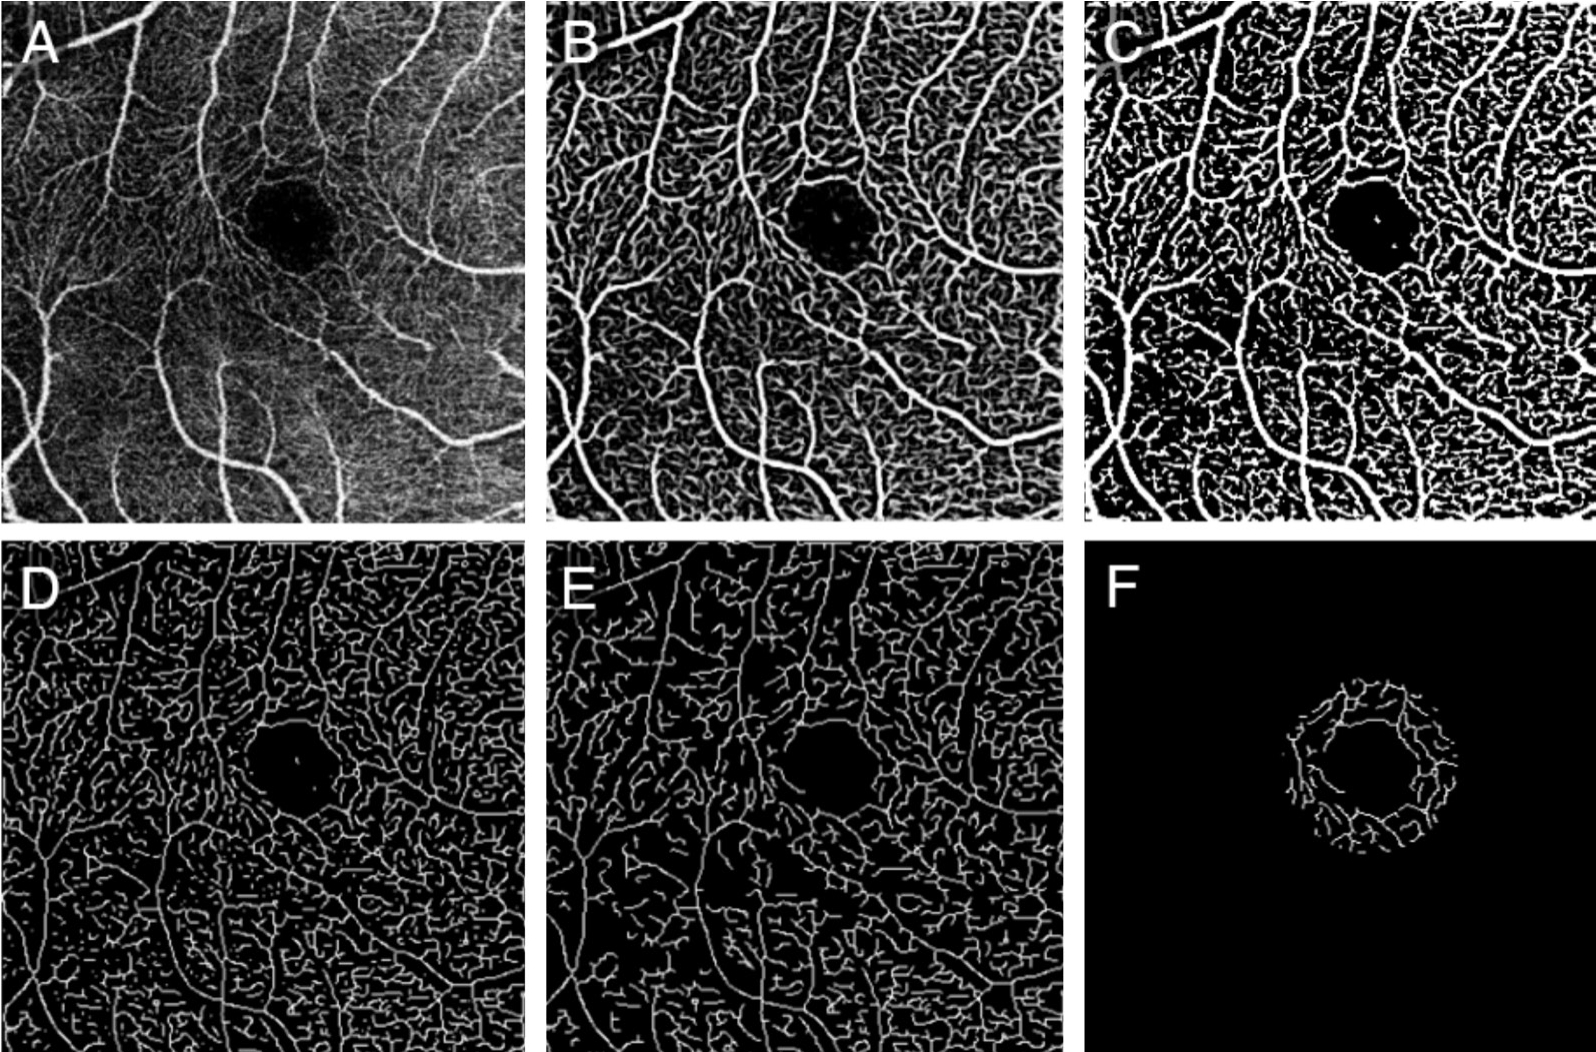
Figure 2 Illustration of evaluating vessel valid visibility A: Original angiographic image of SRL (scan size, 3×3 mm2); B: The vesselness measure of A using Frangi flter; C: Binary vessel mask by thresholding B to distinguish vessels from noise; D: Skeleton of C; E: Effective vessel with length longer than threshold; F: Calculated vessels in a ring shape ROI around the fovea.
Image Quality EvaluationVessel valid visibility evaluation and motion artifacts detection were included in the image quality evaluation.
Vessel Valid Visibility EvaluationVessel valid visibility was defned as the capacity of detecting vessels integrally.To compare the sensitivity of OCTA devices in detecting vessels,a measure independent of scan lateral resolution and scan line number, using MatLab, was proposed[25-26].This included calculating the vessel length detected by OCTA devices in a ring shape region of interest (ROI) around the fovea, with outer diameter of 1.00 mm and inner diameter of 0.36 mm for 3×3 mm2scan, and with outer diameter of 2.00 mm and inner diameter of 0.72 mm for 6×6 mm2scan.The center of fovea was manually specifed by a grader.The application of ROI ensured that the area analyzed excluded errors caused by inevitable small position deviations among scans and trademark logos on the edge of images.

Figure 3 Illustration of detecting motion artifacts A: Original angiographic image of SRL (scan size, 3×3 mm2); B: Plot of correlation for each horizontal line with respect to its next neighbor line, 0.4 set as a threshold.In this sample image, 4 outliers less than 0.4 were detected and marked with arrows; C: Angiogram with motion artifacts are marked as red.The location of artifacts correspond to B.
First, the original angiogram of SRL (Figure 2A) was enhanced using a two-scale (σ=1 and 2 pixels) Frangi vesselness flter[27-28].This flter obtains the vesselness measure (Figure 2B)by analyzing eigenvalues of the second-order local structure of the angiogram (Hessian).A global threshold using Otsu’s method was then calculated and applied to distinguish vessels(larger than threshold) from noise (smaller than threshold),generating a vessel mask (Figure 2C)[29-30].Considering the variety of lateral resolution across devices, the vessel diameter detected may be different for different devices, so the vessels were skeletonized (Figure 2D), then the total length of connected vessels [longer than 3000/(scan line number);Figure 2E] in a ring shape ROI (Figure 2F) was calculated.Considering the variety of scan line number across devices, the vessel valid visibility measure was proposed as the normalized vessel length (vessel length divided by the scan line number)divided by the normalized ROI area (ROI area divided by scan area).To summarize, the vessel valid visibility was a unitless number of ratio between 0 and 1, in which larger values indicated a stronger ability to detect vessels at high quality.
Motion Artifacts DetectionTo detect the motion artifacts,correlation of neighbor B-scan lines were calculated as previously described[22].As motion artifact goes across all layers, only those on SRL were calculated.For the original angiographic image of SRL (Figure 3A), a plot of the correlation between neighboring B-scan lines was generated(Figure 3B).B-scan lines with correlations smaller than 0.4 were counted as motion artifacts (Figure 3C).For most devices, motion artifacts dominates only along the slow scan direction, so only correlation between fast scan lines was calculated.For AngioVue, that uses an orthogonal scan pattern,correlation of lines along two directions (horizontal and vertical) was calculated, and their numbers of motion artifacts were summed as fnal result.
Execution Time MeasurementAcquisition time was recorded from the beginning to the end of the acquisition of the image,excluding patient and system preparation, such as positioning and machine focus.
Statistical AnalysisRepeated mesures analysis of variance(ANOVA) with Bonferroni’s post-test was used to compare vessel valid visibility, acquisition time of AngioVue, AngioPlex,Spectralis OCTA, AngioScan, and SS OCT Angio.Friedman test with Dunn’s post-test was used to compare the number of motion artifacts.Statistical analysis was performed using Prism version 5.0 (GraphPad Software, Inc., La Jolla, Calif.,USA) and SPSS software version 18 (SPSS Inc., Chicago, IL,USA).The distributions of the datasets ANOVA were checked for normality using Kolmogorov-Smirnov tests.The results indicated that the data were normally distributed (P>0.05).APvalue less than 0.05 was considered to be statistically signifcant.
RESULTS
This study enrolled 27 right eyes of 27 subjects (17 men,10 women).The mean age of the subjects was 28.19±5.55y(range, 23-49y).The mean spherical equivalent refraction was-2.55±1.84 D (range, 0.00 to -5.25 D).
Image Quality
Vessel valid visibilityFor the 3×3 mm2scan, the vessel valid visibility derived from AngioVue was 0.111±0.031, from AngioPlex was 0.054±0.033, from Spectralis OCTA was 0.067±0.025, from AngioScan was 0.093±0.023, and from SS OCT Angio was 0.097±0.027 (Figure 4).A repeated measures ANOVA revealed signifcant difference in the average vessel valid visibility (F=326.799,P<0.001) among the fve systems.Bonferroni’s post-test showed no significant difference in 2 pairs out of 10 (AngioScanvsSS OCT Angio, AngioPlexvsSpectralis OCTA) and signifcant difference in the other 8 pairs(Table 2).
For the 6×6 mm2scan, the vessel valid visibility derived from AngioVue was 0.128±0.020, from AngioPlex was 0.047±0.014, from AngioScan was 0.052±0.010 and from SS OCT Angio was 0.066±0.013 (Figure 5).A repeated measures ANOVA demonstrated significant difference in the average vessel valid visibility (F=1828.837,P<0.001) among the four systems.Bonferroni’s post-test showed no significant difference in 1 pair out of 6 (AngioPlexvsAngioScan) and signifcant difference in the other 5 pairs (Table 3).

Figure 4 Results of vessel valid visibility measure of 3×3 mm2scans of a same subject A-E: Original SRL angiograms overlaid with a ring showing ROI, with inner diameter of 0.36 mm (red) and outer diameter of 1.00 mm (green) of 5 systems; F-J: Images after vesselness flter and binary vessel mask of A-E; K-O: Calculated vessels in ROI after skeletonization and thresholding of F-J.
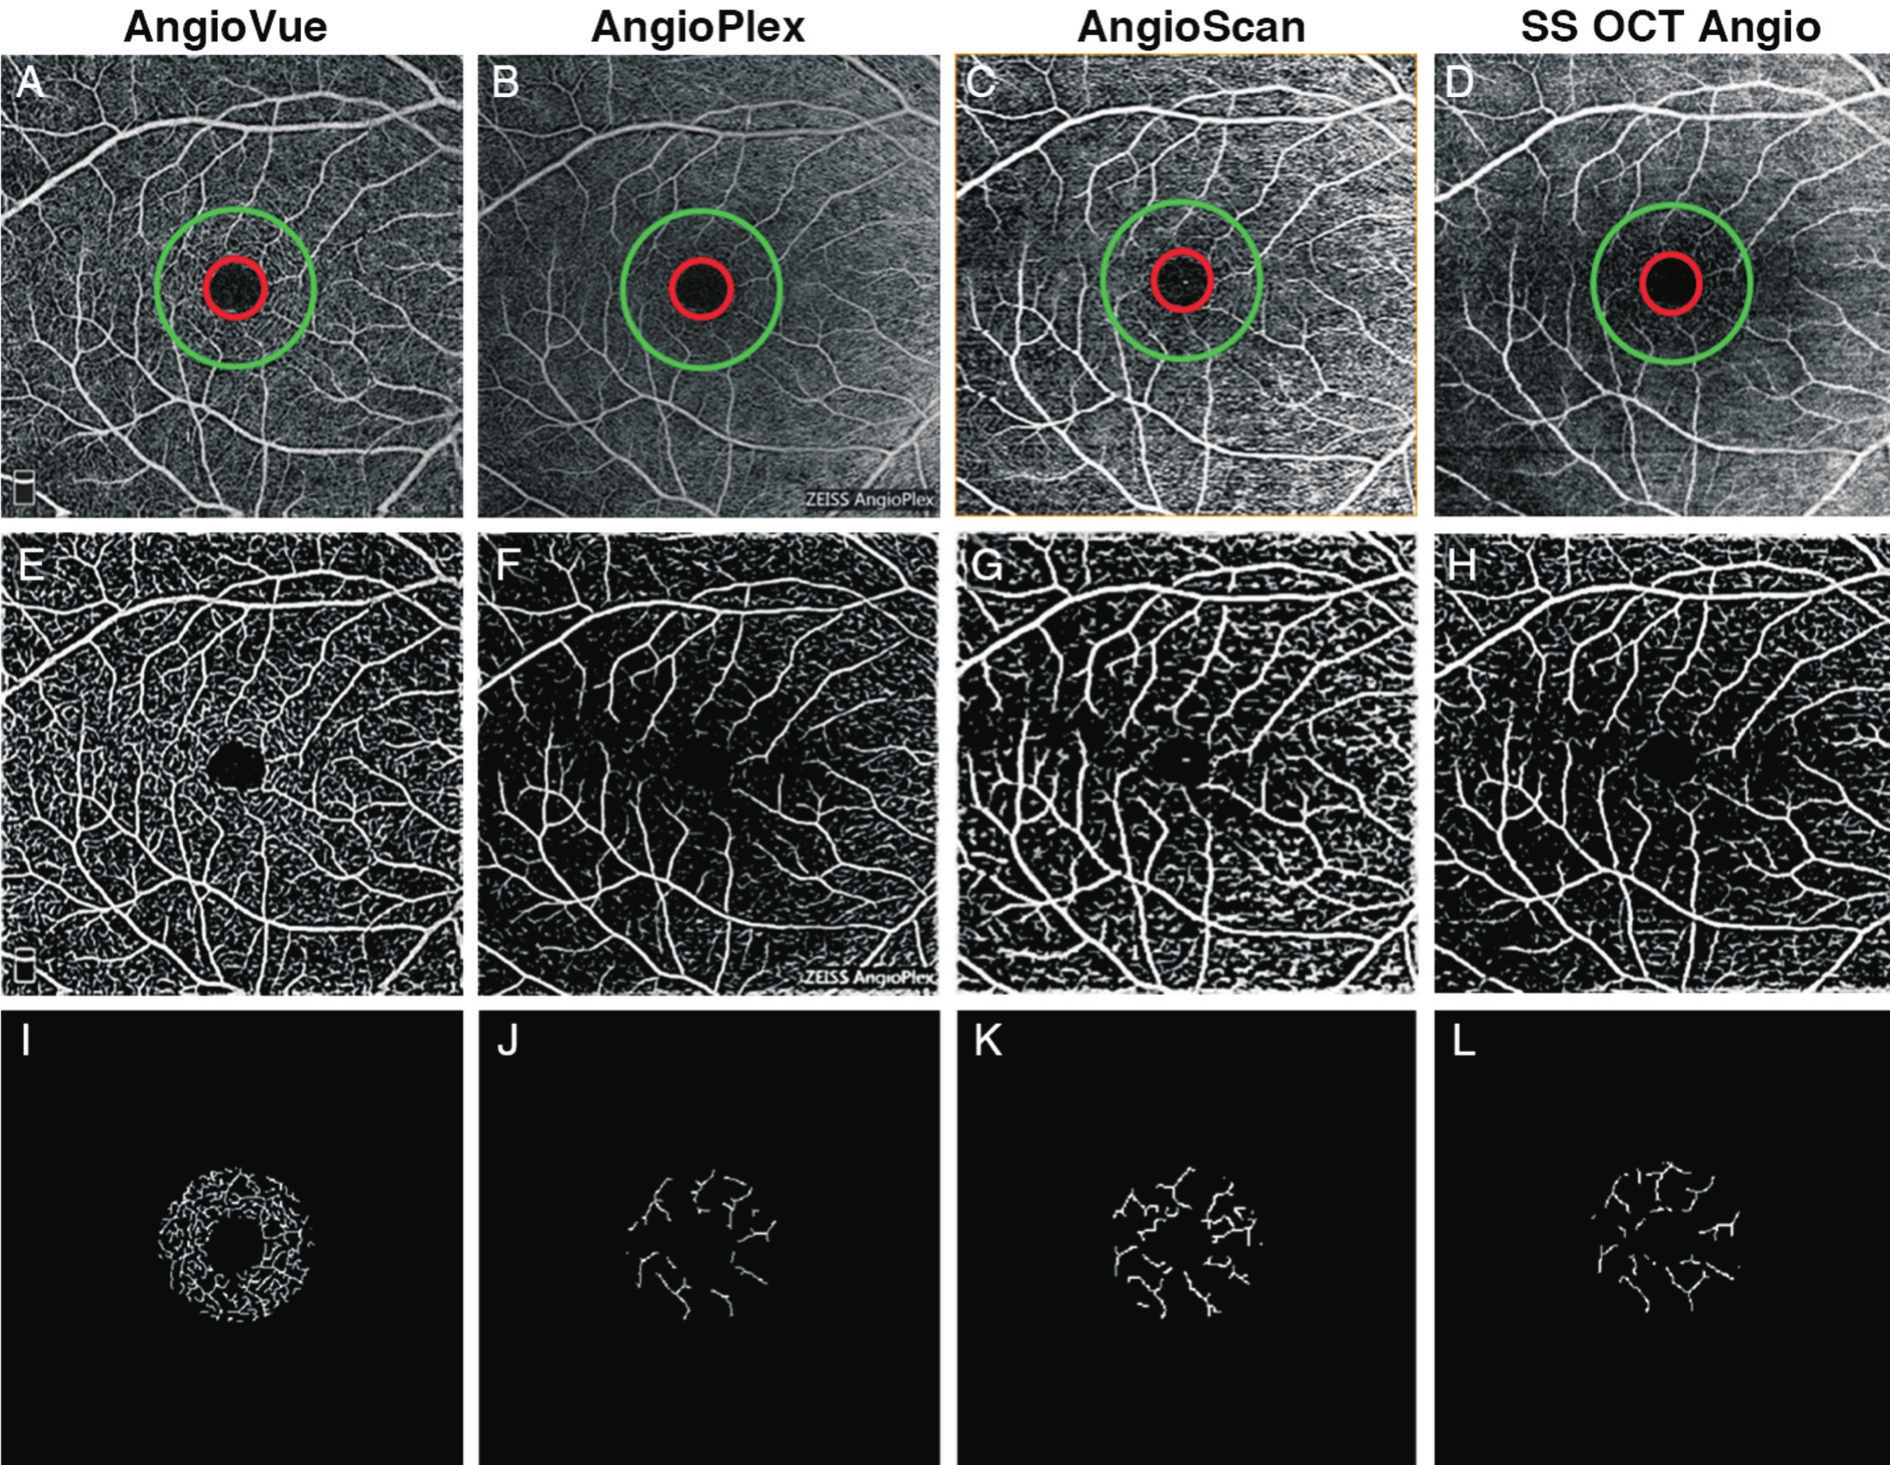
Figure 5 Results of vessel valid visibility measure of 6×6 mm2scans of a same subject A-D: Original SRL angiograms overlaid with ring showing ROI, with inner diameter of 0.72 mm (red) and outer diameter of 2.00 mm (green) of 4 systems; E-H: Images after vesselness flter and binary vessel mask of (A-D);.I-L: Calculated vessels in ROI after skeletonization and thresholding of E-H.
Table 2 Post-hoc comparison among five systems for 3×3 mm2scan

aMean Dif.: Mean difference;bFor motion artifacts comparison, mean difference refers to that of rank sum in Friedman test.
Parameters Vessel valid visibility Motion artifacts Acquisition time (s)Mean Dif.aPMean Dif.bPMean Dif.PAngioVuevsAngioPlex 0.057 <0.001 -1.889 <0.001 0.996 0.215 AngioVuevsSpectralis OCTA 0.044 <0.001 -0.204 0.636 -18.712 <0.001 AngioVuevsAngioScan 0.018 <0.001 -0.574 0.182 -15.910 <0.001 AngioVuevsSS OCT Angio 0.014 0.002 -0.574 0.182 -3.255 0.001 AngioPlexvsSpectralis OCTA -0.013 0.363 1.685 <0.001 -19.708 <0.001 AngioPlexvsAngioScan -0.039 <0.001 1.315 0.002 -16.906 <0.001 AngioPlexvsSS OCT Angio -0.043 <0.001 1.315 0.002 -4.251 <0.001 Spectralis OCTAvsAngioScan -0.026 <0.001 -0.370 0.389 2.803 0.781 Spectralis OCTAvsSS OCT Angio -0.030 <0.001 -0.370 0.389 15.457 <0.001 AngioScanvsSS OCT Angio -0.004 1.000 0.000 1.000 12.654 <0.001
Table 3 Post-hoc comparison among four systems for 6×6 mm2scan

aMean Dif.: Mean difference;bFor motion artifacts comparison, mean difference refers to that of rank sum in Friedman test.
Parameters Vessel valid visibility Motion artifacts Acquisition time (s)Mean Dif.aPMean Dif.bPMean Dif.PAngioVuevsAngioPlex 0.080 <0.001 -1.389 <0.001 6.183 <0.001 AngioVuevsAngioScan 0.076 <0.001 -1.963 <0.001 -10.357 <0.001 AngioVuevsSS OCT Angio 0.062 <0.001 -1.019 0.004 2.185 0.007 AngioPlexvsAngioScan -0.005 0.488 -0.574 0.102 -16.540 <0.001 AngioPlexvsSS OCT Angio -0.019 <0.001 0.370 0.292 -3.998 <0.001 AngioScanvsSS OCT Angio -0.014 <0.001 0.944 0.007 12.543 <0.001
Motion ArtifactsFor 3×3 mm2scan, the number of motion artifacts per scan derived from AngioVue was 0.778±1.086,from AngioPlex was 4.926±4.047, from Spectralis OCTA was 1.037±1.126, from AngioScan was 1.556±1.987 and from SS OCT Angio was 1.926±2.319 (Figure 6).A Friedman test revealed significant difference in the number of motion artifacts (Friedman statistic=28.160,P<0.001) among the fve systems.Dunn’s post-test revealed no signifcant difference in 6 pairs out of 10 (AngioVuevsSpectralis OCTA, AngioVuevsAngioScan, AngioVuevsSS OCT Angio, Spectralis OCTAvsAngioScan, Spectralis OCTAvsSS OCT Angio, and AngioScanvsSS OCT Angio) and signifcant difference in the other 4 pairs (Table 2).
For the 6×6 mm2scan, the number of motion artifacts in each scan derived from AngioVue was 0.333±0.620, AngioPlex was 5.741±5.432, AngioScan was 7.889±5.912, and SS OCT Angio was 2.667±4.197.A Friedman test revealed signifcant difference in the number of motion artifacts (Friedman statistic=35.629,P<0.001) among the four systems (Figure 7).Dunn’s post-test showed no significant difference in 2 pairs out of 6 (AngioPlexvsAngioScan, and AngioPlexvsSS OCT Angio) and signifcant difference in the other 4 pairs (Table 3).
Acquisition TimeFor the 3×3 mm2scan, the acquisition time for each scan derived from AngioVue was 9.533±2.012s,AngioPlex was 8.537±1.921s, Spectralis OCTA was 28.246±2.678s, AngioScan was 25.443±2.860s, and SS OCT Angio was 12.789±2.864s.A repeated measures ANOVA revealed signifcant difference in the average acquisition time(F=5689.860,P<0.001) among the fve systems.Bonferroni’s post-test showed no signifcant difference in 2 pairs out of 10(AngioVuevsAngioPlex, and Spectralis OCTAvsAngioScan)and signifcant difference in the other 8 pairs (Table 2).
For the 6×6 mm2scan, the acquisition time for each scan derived from AngioVue was 14.481±2.423s, AngioPlex was 8.298±1.741s, AngioScan was 24.838±2.389s, and SS OCT Angio was 12.295±2.377s.A repeated measures ANOVA demonstrated signifcant difference in the average acquisition time(F=4004.544,P<0.001) among the four systems.Bonferroni’s post-test displayed signifcant difference in all 6 pairs (Table 3).
DISCUSSION
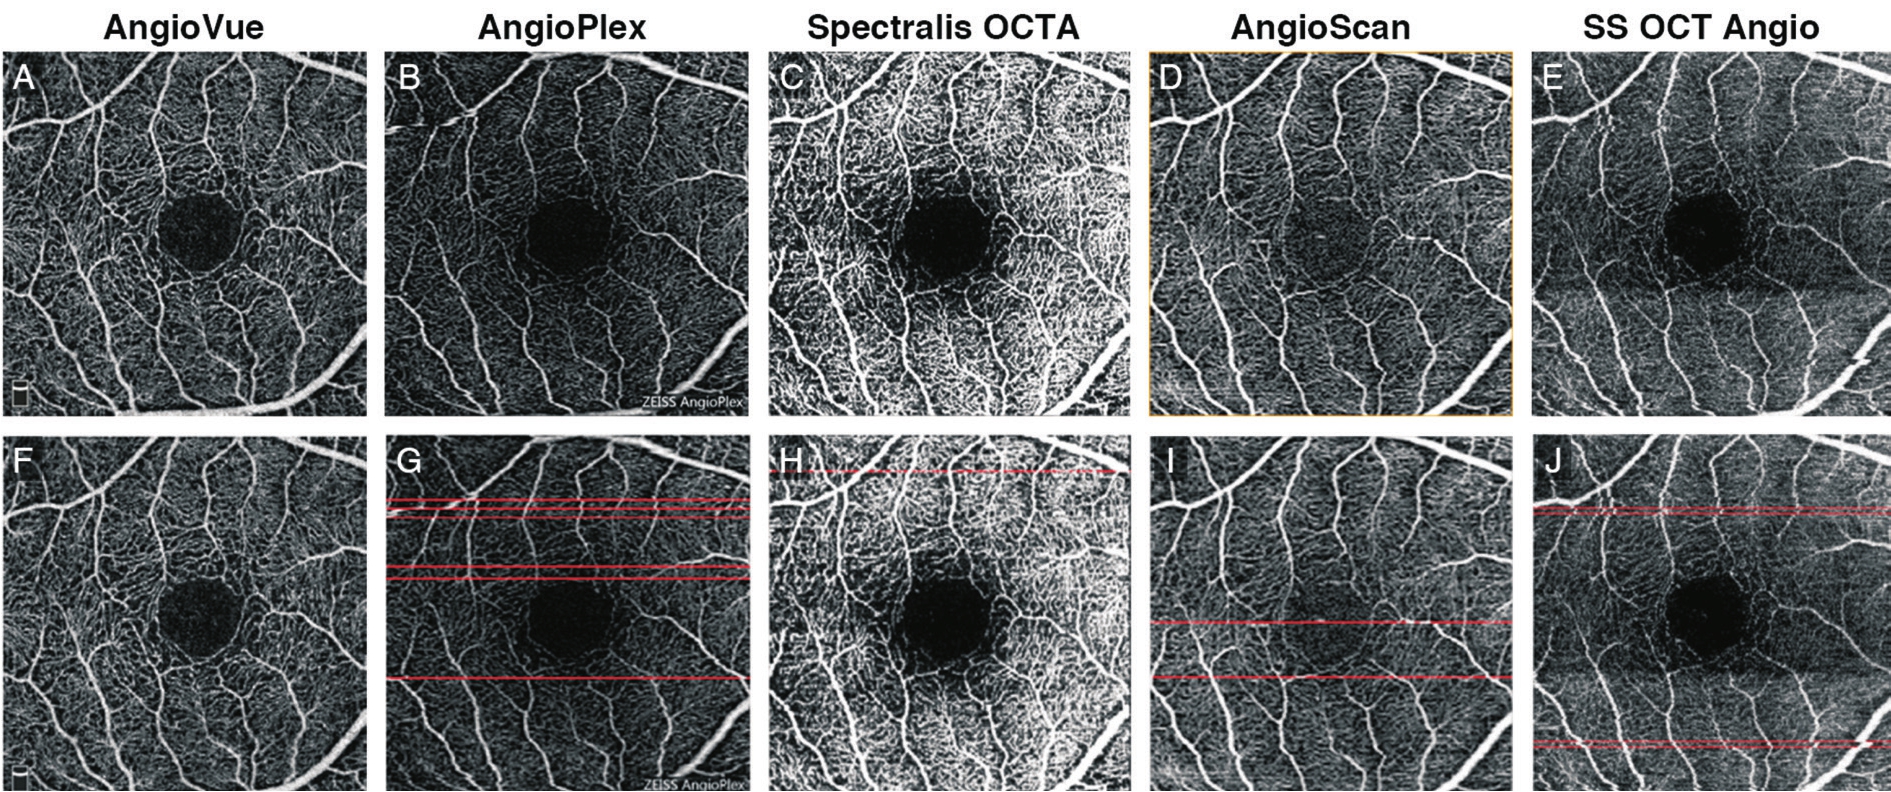
Figure 6 Results of motion artifacts detection of 3×3 mm2scans of a same subject A-E: Original SRL angiographic images obtained from different systems; F-J: Angiogram overlaid with red line marking detected motion artifacts.
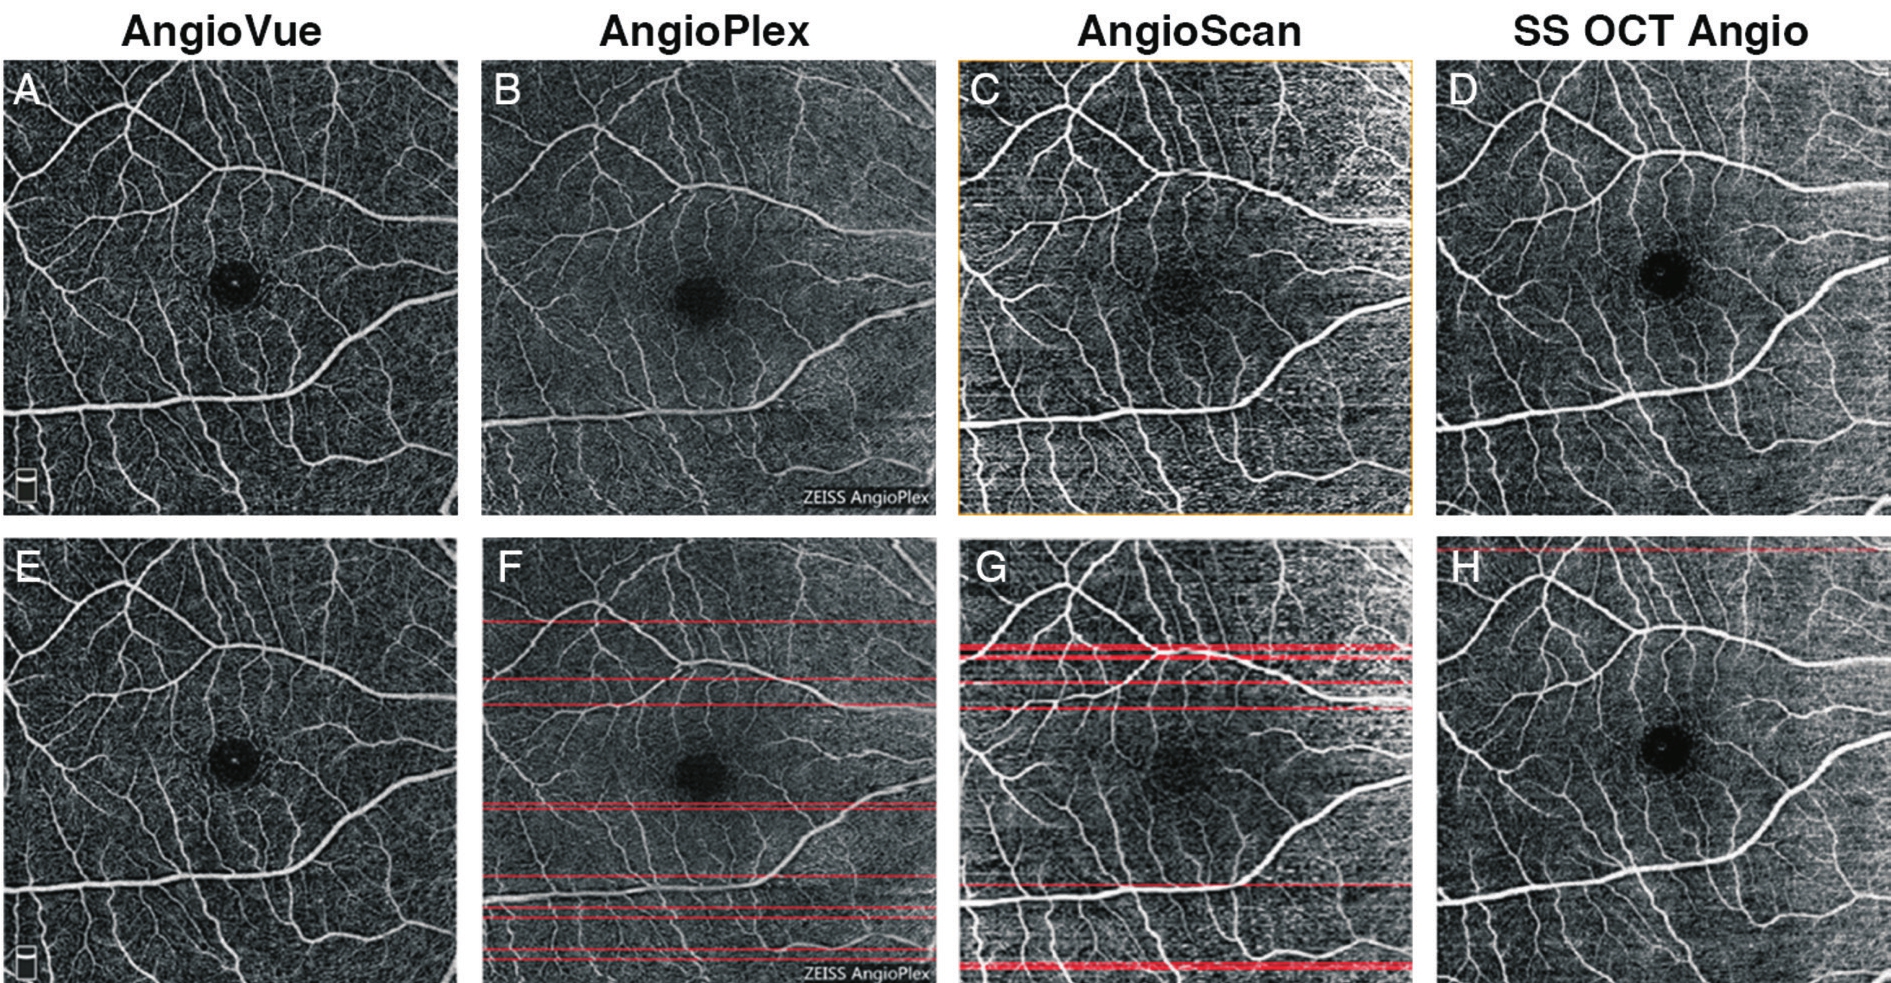
Figure 7 Results of motion artifacts detection of 6×6 mm2scans of a same subject A-D: Original SRL angiographic images obtained from different systems; E-H: Angiogram overlaid with red line marking detected motion artifacts.
OCTA is one of the most important prospective imaging modalities in ophthalmology of the last few years[2].It can generate not only cross-sectional OCT images with micrometer-scale depth resolution, but also functional OCT images displayed as en-face angiograms, showing retinal and choroidal vessel function[3,31-32].Despite some limitations in detection of vascular leakage, it frees subjects from a timeconsuming angiography procedure and risks of complications due to invasive conventional angiography[33-34].Currently,different OCTA systems built by different manufacturers are employed worldwide.In addition, different hardware and software are applied to achieve the same purpose of visualization of vasculature details[8].The various systems’agreement and precision evaluation are mandatory for both the clinical practice and research settings.A previous study conducted an evaluation concerning AngioVue and AngioPlex,and differences were found concerning their execution time and motion artifacts[24].Another study involving AngioVue,AngioPlex, Spectralis OCTA and SS OCT angio demonstrated that their angiograms shared similar vessel density but different motion artifacts level[35].This study developed innovative and quantitative methods in evaluation of image quality and execution time, as well as aspects of reliability across five OCTA instruments, including AngioVue, AngioPlex, Spectralis OCTA, AngioScan, and SS OCT Angio.In our population of young healthy adults with normal vision, there was poor agreement of measurements among systems, indicating their results are not all interchangeable, and they could not be substituted for the others at this time[36].
In our study, AngioVue demonstrated the highest vessel valid visibility and least number of motion artifacts for both 3×3 and 6×6 mm2scan, which may result from its proper scan pattern.AngioVue employs the SSADA algorithm.This algorithm splits the spectrum, individual decorrelation images can be averaged, and images with good vessel connectivity and high signal-to-noise can be generated[2].AngioVue requires two orthogonal scans (x-fast and y-fast) in each acquisition.The MCT software then builds a single volumetric data set, and most motion artifacts and changes in brightness are corrected using MCT and DualTrac tracking technology[20,37].AngioVue’s performance in vessel valid visibility was remarkable in the 6×6 mm2scan group, as vascular details such as macular arch ring can be clearly observed.In the 6×6 mm2scan, AngioVue has the most intensive A-scan count in both horizontal and vertical directions (400×400), and the distance interval between scan lines accords with speckle diameter, achieving a perfect balance between image quality and scan effciency.However, with the employment of MCT and DuralTrac,AngioVue sacrifices its performance in terms of acquisition,saving, and analysis time.
AngioPlex showed its advantage in acquisition time for both 3×3 and 6×6 mm2scan, in comparison with other devices.The algorithm of OMAG is applied in AngioPlex, and it extracts both phase and magnitude signal algorithm from retinal blood flow with better efficacy[7,38].The FastTrac retinal-tracking technology can monitor and correct for the motion of the eye in real time.FastTrac ensures faster data acquisition by only rescanning selective data that might be affected by motion.Shorter acquisition time is beneficial for patient comfort,especially for those with dry eyes or poor fxation caused by low visual acuity.Physicians beneft from shorter acquisition time as well.AngioPlex has patented superficial projection elimination technology to reduce projection artifacts.AngioPlex’s ganglion cell analysis is another special feature,helpful for patients with glaucoma[23,39].
Spectralis OCTA can only perform the 3×3 mm2scan, not the 6×6 mm2scan at the moment of our study.The average number of motion artifacts is only 1.037, as the SMARTTrack technology effectively tracks eye motion, which reduces motion artifacts.Spectralis OCTA is one of the components of the multimodal imaging system based on the Spectralis OCT2.Its OCT angiogram or structural OCT images can overlay on MultiColor or IR images at the same position on the retina,and traditional fuorescein and indocyanine green angiography could be performed as well on a single device.Spectralis OCTA segments SRL and DRL into two “sub-layers”.It segments SRL as one sub-layer within the retinal nerve fber layer (RNFL) and the other within ganglion cell layer (GCL).DRL is divided into sub-layer ranges of IPL to INL and INL to OPL.This segmentation setting fit with retinal vascular network anatomy[13].
AngioScan uses complex difference as its algorithm, and as previously discussed, it is an algorithm based on both phase and magnitude signals of retinal blood fow.Previous studies revealed AngioScan’s outstanding data computation abilities,demonstrated as lower computational cost, indicating its practicability[7,14].It should also be mentioned that our result may also relate to selected scan pattern, as AngioScan4 contains less data than AngioScan8 mode.
SS OCT Angio is a commercially available OCTA device using swept-source optical source[11].It utilizes a tunable laser with a wavelength of 1050 nm, much longer than that of other OCTA devices.The longer wavelength reduces scattering and absorption of the RPE, allowing for deeper penetration of light into the choroid, increasing possibility of visualization of the whole choroid, or even the sclera[40-41].The scan line of SS OCT Angio is quasi invisible, which greatly improves patient comfort.Furthermore, with a scan speed of 100 000 A-scans per second, SS-OCTA has the potential to perform better than SD-OCTA, and several studies already supported this argument[42-45].
Convincing methodology was applied in our study.All measurements were evaluated quantitatively, so the results are less subjective than some qualitative methods.For image quality evaluation, vessel valid visibility, and number of motion artifacts evaluation, all thresholds remained consistent throughout all subjects for all devices, demonstrating that the results of our comparison were not influenced by personal preference.For acquisition time evaluation, arithmetic means measured by two timekeepers were evaluated, in order to minimize random error.It should be mentioned that for an OCTA system with fxed technical parameters, it takes longer acquisition time to get a higher quality image and vice versa.In our study, AngioVue, AngioPlex, and SS OCT Angio were applied with most intensive A-scans possible, while Spectralis OCTA and AngioScan not because the latter two systems require much longer acquisition.In this assessment, we chose the most frequently used scan patterns in our clinical practice.These quantitative methods could not only be applied on current version of OCTA, but also be valid following the next software update.
Vessel valid visibility refers to the capacity of detecting vessels integrally.Retinal vasculature impairment and microvascular abnormalities could be found in common diseases such as branch retinal vein occlusion (BRVO) and diabetic retinopathy(DR), and sensible vessel detection with high image quality lays a foundation in determining treatment and follow-up plans for physicians.SRL is the ideal layer to conduct this evaluation for several reasons.First, it has the least variation in layer segmentation definition comparing to other layers.Second, blood in this layer flows vertically to the scan’s optical source and parallel to displayed angiograms, so we can observe distinct retinal superficial capillaries on SRL.This makes several deviation removal procedures, such as skeletonization possible.Third, projection artifact, the falsepositive blood fow signal, is absent on SRL according to its defnition.Fourth, foveal avascular zone (FAZ) is the perfect reference point to locate the center of ROI.Although all scans are centered on the macula, small position deviation due to eye motion is still inevitable.Using this device, the largest possible circle in the fovea that did not include any vessels can be manually drawn, and the center of this circle is then used as the fovea center and the center of ROI.This method reduced the variation in specifying fovea center across systems, which is essential for an objective comparison.Moreover, as images were focused on the macula, ROI is the region less affected by focus difference, compared to the peripheral zone of an angiogram.Proper size of ROI is essential.An ROI that is too large leads to inaccuracy caused by stretch artifacts, logos or marks on the edge of some systems, or minimal loss of focus on the periphery.An ROI that is too small uses too little vessel information in an angiographic image, which may also lead to inaccuracy in evaluation.To reach a balance, for 3×3 mm2scans,the inner and outer diameters of the ring ROI is empirically chosen as 0.36 and 1.00 mm.Considering that 6×6 mm2scans generally has lower scan density than 3×3 mm2scans, larger diameters were used (inner and outer diameters as 0.72 and 2.00 mm).It should be noticed that small variations of those diameter settings did not affect the results significantly.In order to eliminate the noise, which appears as high signal irregular dots, Otsu’s method was applied, and it could not only distinguish vessels from noise, but also remove poorly detected vessels with low continuity from calculation[28,46-47].To avoid the infuence originated from different systems intrinsic properties, for instance the lateral resolution determined by the number of B-scan, angiograms were skeletonized in our study.Motion artifacts originate from eye motion and failure of software technique removal.Since they contain a collection of pixels with abnormal signal intensity, inaccuracies can be introduced during qualitative and quantitative evaluation of clinically useful parameters.Motion artifacts appear as linear defects on an angiographic image.Some appear as false signals with intensity randomly allocated between maximal and minimal, while others appear as vessel malposition.Though motion artifacts go across all layers in the same B-scan line, SRL is the most sensitive layer to locate them,as it appears as tubular continuous vessels.Their correlation between neighboring B-scan lines is low, which makes automated motion artifacts count possible[5,19,22].The threshold of correlation can range from 0 to 1, and correlations lower than the threshold was considered to be motion artifacts.It is obvious to fnd that as the value of threshold increases, the sensitivity of detection decreases, and the specifcity increases.As long as the threshold is less than 1, there is an inevitable possibility of visible motion artifacts not included in the count, so it is vital to set an equal threshold for all devices.In this study, 0.4 was set empirically as the global threshold, as sensitivity and specifcity are balanced using this value.
Acquisition time refects both hardware and software effciency integrally.Lower acquisition time largely facilitates image acquisition for patients with diffculties in vision fxation due to dry eye or poor vision and improves satisfactions for both participants and physicians.Hardware outside OCT devices like hard drive capacity and graphics properties could also infuence it, but there are minimal differences across different OCTA unit with the same model and software version.As such, acquisition time could still be a representative parameter and represent objective systems performances in real world.
This current study has several limitations.Due to the nature of our subject selection, our subjects were relatively young and had good visual acuity.Our study aims to compare the clinical performance of five OCTA systems, and this population was selected as they provide the best and steadiest compliance.There are other OCTA systems which were not evaluated in this study, such as Angio eXpert of Canon and the SOCT Copernicus REVO of Optopol.In this study, aspects of precision of the fve devices such as intraobserver repeatability or intersession reproducibility, were not compared.This is the subject of an ongoing study.Moreover, in this population,other image defects like artifacts caused by media opacity,stretch artifacts, and segmentation defects are unlikely to be seen[5].Further investigation is needed to compare clinical performance on these fve systems in patients with poor vision caused by retinal vascular diseases and older age.
In conclusion, the findings of this study have significant implications.AngioVue, AngioPlex, Spectralis OCTA,AngioScan, and SS OCT Angio are all useful imaging devices and can be easily performed in clinical practice.All of them have their own advantage.AngioVue has outperformed others in image quality, as vessels are visualized in detail with less interference.AngioPlex required the shortest time in data acquisition, leading to more satisfied participants.Spectralis OCTA is part of the multimodal imaging unit, facilitating comparison of different examinations on the exact same position of retina.AngioScan displayed its advantages in its algorithm.SS OCT Angio, a commercially available SSOCTA, greatly improves patients’ comfort.The quantitative methods used in this study are innovative and objective.They can be applied to the evaluation of future OCTA systems as well.
ACKNOWLEDGEMENTS
Foundation:Supported by National Key Research and Development Program for Precision Medicine of China(No.2016YFC0904800).
Conflicts of Interest:Li XX, None; Wu W, None; Zhou H,None; Deng JJ, None; Zhao MY, None; Qian TW, None;Yan C, None; Xu X, None; Yu SQ, None.
REFERENCES
1 Jia Y, Bailey ST, Hwang TS, McClintic SM, Gao SS, Pennesi ME,Flaxel CJ, Lauer AK, Wilson DJ, Hornegger J, Fujimoto JG, Huang D.Quantitative optical coherence tomography angiography of vascular abnormalities in the living human eye.Proc Natl Acad Sci U S A2015;112(18):E2395-E2402.
2 Jia Y, Tan O, Tokayer J, Potsaid B, Wang Y, Liu JJ, Kraus MF, Subhash H, Fujimoto JG, Hornegger J, Huang D.Split-spectrum amplitudedecorrelation angiography with optical coherence tomography.Opt Express2012;20(4):4710-4725.
3 Puliafito CA.OCT angiography: the next era of OCT technology emerges.Ophthalmic Surg Lasers Imaging Retina2014;45(5):360.
4 Jia Y, Bailey ST, Wilson DJ, Tan O, Klein ML, Flaxel CJ, Potsaid B,Liu JJ, Lu CD, Kraus MF, Fujimoto JG, Huang D.Quantitative optical coherence tomography angiography of choroidal neovascularization in age-related macular degeneration.Ophthalmology2014;121(7):1435-1444.
5 Spaide RF, Fujimoto JG, Waheed NK.Image artifacts in optical coherence tomography angiography.Retina2015;35(11):2163-2180.
6 Zysk AM, Nguyen FT, Oldenburg AL, Marks DL, Boppart SA.Optical coherence tomography: a review of clinical development from bench to bedside.J Biomed Opt2007;12(5):051403.
7 Zhang A, Zhang Q, Chen CL, Wang RK.Methods and algorithms for optical coherence tomography-based angiography: a review and comparison.J Biomed Opt2015;20(10):100901.
8 de Carlo TE, Romano A, Waheed NK, Duker JS.A review of optical coherence tomography angiography (OCTA).Int J Retina Vitreous2015;1:5.
9 Wang RK, An L, Francis P, Wilson DJ.Depth-resolved imaging of capillary networks in retina and choroid using ultrahigh sensitive optical microangiography.Opt Lett2010;35(9):1467-1469.
10 Wang RK.Optical Microangiography: a label free 3D imaging technology to visualize and quantify blood circulations within tissue beds in vivo.IEEE J Sel Top Quantum Electron2010;16(3):545-554.
11 Stanga PE, Tsamis E, Papayannis A, Stringa F, Cole T, Jalil A.Sweptsource optical coherence tomography Angio™ (Topcon Corp, Japan):technology review.Dev Ophthalmol2016;56:13-17.
12 Huang D, Jia Y, Gao SS, Lumbroso B, Rispoli M.Optical coherence tomography angiography using the optovue device.Dev Ophthalmol2016;56:6-12.
13 Coscas G, Lupidi M, Coscas F.Heidelberg spectralis optical coherence tomography angiography: technical aspects.Dev Ophthalmol2016;56:1-5.
14 Al-Sheikh M, Tepelus TC, Nazikyan T, Sadda SR.Repeatability of automated vessel density measurements using optical coherence tomography angiography.Br J Ophthalmol2017;101(4):449-452.
15 Matsunaga D, Yi J, Puliafito CA, Kashani AH.OCT angiography in healthy human subjects.Ophthalmic Surg Lasers Imaging Retina2014;45(6):510-515.
16 Spaide RF, Klancnik JM Jr, Cooney MJ.Retinal vascular layers imaged by fluorescein angiography and optical coherence tomography angiography.JAMA Ophthalmol2015;133(1):45-50.
17 Jung JJ, Chen MH, Rofagha S, Lee SS.Graft-Versus-Host disease panuveitis and bilateral serous detachments: multimodal imaging analysis.Retin Cases Brief Rep2017;11(Suppl 1):S54-S61.
18 Awh CC, Miller JB, Wu DM, Eliott D.Leukostasis retinopathy: a new clinical manifestation of chronic myeloid leukemia with severe hyperleukocytosis.Ophthalmic Surg Lasers Imaging Retina2015;46(7):768-770.
19 Say EAT, Ferenczy S, Magrath GN, Samara WA, Khoo CTL, Shields CL.Image quality and artifacts on optical coherence tomography angiography: comparison of pathologic and paired fellow eyes in 65 patients with unilateral choroidal melanoma treated with plaque radiotherapy.Retina2017;37(9):1660-1673.
20 Kraus MF, Potsaid B, Mayer MA, Bock R, Baumann B, Liu JJ,Hornegger J, Fujimoto JG.Motion correction in optical coherence tomography volumes on a per A-scan basis using orthogonal scan patterns.Biomed Opt Express2012;3(6):1182-1199.
21 Zhang A, Zhang Q, Wang RK.Minimizing projection artifacts for accurate presentation of choroidal neovascularization in OCT microangiography.Biomed Opt Express2015;6(10):4130-4143.
22 Camino A, Zhang M, Gao SS, Hwang TS, Sharma U, Wilson DJ,Huang D, Jia Y.Evaluation of artifact reduction in optical coherence tomography angiography with real-time tracking and motion correction technology.Biomed Opt Express2016;7(10):3905-3915.
23 Rosenfeld PJ, Durbin MK, Roisman L, Zheng F, Miller A, Robbins G, Schaal KB, Gregori G.ZEISS Angioplex™ spectral domain optical coherence tomography angiography: technical aspects.Dev Ophthalmol2016;56:18-29.
24 De Vitis LA, Benatti L, Tomasso L, Baldin G, Carnevali A, Querques L,Querques G, Bandello F.Comparison of the performance of two different spectral-domain optical coherence tomography angiography devices in clinical practice.Ophthalmic Res2016;56(3):155-162.
25 Chen CL, Bojikian KD, Xin C, Wen JC, Gupta D, Zhang Q,Mudumbai RC, Johnstone MA, Chen PP, Wang RK.Repeatability and reproducibility of optic nerve head perfusion measurements using optical coherence tomography angiography.J Biomed Opt2016;21(6):65002.
26 Dong J, Jia YD, Wu Q, Zhang S, Jia Y, Huang D, Wang X.Interchangeability and reliability of macular perfusion parameter measurements using optical coherence tomography angiography.Br J Ophthalmol2017;101(11):1542-1549.
27 Frangi AF, Niessen WJ, Vincken KL, Viergever MA.Multiscale vessel enhancement filtering.In: Wells WM, Colchester A, Delp S.(eds) Medical Image Computing and Computer-Assisted Intervention-MICCAI’98.MICCAI 1998.Lecture Notes in Computer Science.Berlin:Springer,1998;1496:130-137.
28 Zhang M, Hwang TS, Dongye C, Wilson DJ, Huang D, Jia Y.Automated quantifcation of nonperfusion in three retinal plexuses using projection-resolved optical coherence tomography angiography in diabetic retinopathy.Invest Ophthalmol Vis Sci2016;57(13):5101-5106.
29 Otsu N.A threshold selection method from gray-level histograms.IEEE Trans Syst Man Cybern1979;9(1):62-66.
30 Dongye C, Zhang M, Hwang TS, Wang J, Gao SS, Liu L, Huang D,Wilson DJ, Jia Y.Automated detection of dilated capillaries on optical coherence tomography angiography.Biomed Opt Express2017;8(2):1101-1109.
31 Drexler W, Liu M, Kumar A, Kamali T, Unterhuber A, Leitgeb RA.Optical coherence tomography today: speed, contrast, and multimodality.J Biomed Opt2014;19(7):071412.
32 Congdon N, O'Colmain B, Klaver CC, Klein R, Munoz B, Friedman DS, Kempen J, Taylor HR, Mitchell P; Eye Diseases Prevalence Research Group.Causes and prevalence of visual impairment among adults in the United States.Arch Ophthalmol2004;122(4):477-485.
33 Yannuzzi LA, Rohrer KT, Tindel LJ, Sobel RS, Costanza MA, Shields W, Zang E.Fluorescein angiography complication survey.Ophthalmology1986;93(5):611-617.
34 Hope-Ross M, Yannuzzi LA, Gragoudas ES, Guyer DR, Slakter JS,Sorenson JA, Krupsky S, Orlock DA, Puliafto CA.Adverse reactions due to indocyanine green.Ophthalmology1994;101(3):529-533.
35 Munk MR, Giannakaki-Zimmermann H, Berger L, Huf W, Ebneter A,Wolf S, Zinkernagel MS.OCT-angiography: a qualitative and quantitative comparison of 4 OCT-A devices.PLoS One2017;12(5):e0177059.
36 Bland JM, Altman DG.Statistical methods for assessing agreement between two methods of clinical measurement.Lancet1986;1(8476):307-310.
37 Kraus MF, Liu JJ, Schottenhamml J, Chen CL, Budai A, Branchini L, Ko T, Ishikawa H, Wollstein G, Schuman J, Duker JS, Fujimoto JG, Hornegger J.Quantitative 3D-OCT motion correction with tilt and illumination correction, robust similarity measure and regularization.Biomed Opt Express2014;5(8):2591-2613.
38 Reif R, Qin J, An L, Zhi Z, Dziennis S, Wang R.Quantifying optical microangiography images obtained from a spectral domain optical coherence tomography system.Int J Biomed Imaging2012;2012:509783.
39 Kwon J, Choi J, Shin JW, Lee J, Kook MS.Alterations of the foveal avascular zone measured by optical coherence tomography angiography in glaucoma patients with central visual feld defects.Invest Ophthalmol Vis Sci2017;58(3):1637-1645.
40 Zhang Q, Chen CL, Chu Z, Zheng F, Miller A, Roisman L, Rafael de Oliveira Dias J, Yehoshua Z, Schaal KB, Feuer W, Gregori G, Kubach S, An L, Stetson PF, Durbin MK, Rosenfeld PJ, Wang RK.Automated quantitation of choroidal neovascularization: a comparison study between spectral-domain and swept-source OCT angiograms.Invest Ophthalmol Vis Sci2017;58(3):1506-1513.
41 Barteselli G, Bartsch DU, Weinreb RN, Camacho N, Nezgoda JT, Marvasti AH, Freeman WR.Real-time full-depth visualization of posterior ocular structures: comparison between full-depth imaging spectral domain optical coherence tomography and swept-source optical coherence tomography.Retina2016;36(6):1153-1161.
42 Ting DS, Cheung GC, Lim LS, Yeo IY.Comparison of swept source optical coherence tomography and spectral domain optical coherence tomography in polypoidal choroidal vasculopathy.Clin Exp Ophthalmol2015;43(9):815-819.
43 Zhang Q, Wang RK, Chen CL, Legarreta AD, Durbin MK, An L,Sharma U, Stetson PF, Legarreta JE, Roisman L, Gregori G, Rosenfeld PJ.Swept source optical coherence tomography angiography of neovascular macular telangiectasia type 2.Retina2015;35(11):2285-2299.
44 Novais EA, Adhi M, Moult EM, Louzada RN, Cole ED, Husvogt L, Lee B, Dang S, Regatieri CV, Witkin AJ, Baumal CR, Hornegger J, Jayaraman V, Fujimoto JG, Duker JS, Waheed NK.Choroidal neovascularization analyzed on ultrahigh-speed swept-source optical coherence tomography angiography compared to spectral-domain optical coherence tomography angiography.Am J Ophthalmol2016;164:80-88.
45 Miller AR, Roisman L, Zhang Q, Zheng F, Rafael de Oliveira Dias J,Yehoshua Z, Schaal KB, Feuer W, Gregori G, Chu Z, Chen CL, Kubach S, An L, Stetson PF, Durbin MK, Wang RK, Rosenfeld PJ.Comparison between spectral-domain and swept-source optical coherence tomography angiographic imaging of choroidal neovascularization.Invest Ophthalmol Vis Sci2017;58(3):1499-1505.
46 Suzuki N, Hirano Y, Yoshida M, Tomiyasu T, Uemura A, Yasukawa T,Ogura Y.Microvascular abnormalities on optical coherence tomography angiography in macular edema associated with branch retinal vein occlusion.Am J Ophthalmol2016;161:126-132.e1.
47 Hwang TS, Gao SS, Liu L, Lauer AK, Bailey ST, Flaxel CJ, Wilson DJ, Huang D, Jia Y.Automated quantifcation of capillary nonperfusion using optical coherence tomography angiography in diabetic retinopathy.JAMA Ophthalmol2016;134(4):367-373.
Citation:Li XX, Wu W, Zhou H, Deng JJ, Zhao MY, Qian TW, Yan C, Xu X, Yu SQ.A quantitative comparison of fve optical coherence tomography angiography systems in clinical performance.Int J Ophthalmol2018;11(11):1784-1795
DOl:10.18240/ijo.2018.11.09
Accepted:2018-07-06
Received:2018-05-14
Corresponding to:Su-Qin Yu.Department of Ophthalmology,Shanghai General Hospital Affiliated to Shanghai Jiao Tong University, 100 Haining Road, Shanghai 20080, China.sq-yu@163.com