
・Basic Research・
Expression
and role of autophagy related protein p62 and LC
Yu-Yu
Wu, Bing-Ru Zheng, Wan-Zhu Chen, Mao-Sheng Guo, Yi-Hong Huang, Yan Zhang
Department of Ophthalmology, the
Second Affiliated Hospital of Fujian Medical University, Quanzhou 362000,
Fujian Province, China
Correspondence to: Yu-Yu Wu. Department of
Ophthalmology, the Second Affiliated Hospital of Fujian Medical University, No.
34, Zhongshan Bei Road, Quanzhou 362000, Fujian Province, China.
wyyeyedoctor@qq.com
Received:
Abstract
AIM: To investigate the
expression and possible role of the autophagy related protein p62 and LC
METHODS: Fifty rats were
randomized into five groups: control group A, B, C, and D. Groups A to D all
received normal saline perfusion into the anterior chamber with pressure of
RESULTS: The number of retinal
ganglion cells (RGCs) decreased with increasing reperfusion time, and
significant reduction in the retinal thickness was observed 48h after
perfusion. In normal adult rats, LC3 protein was mainly expressed in the
ganglion cell layer (GCL), and p62 protein was expressed in the nerve fiber
layer (NFL), GCL, inner plexiform layer (IPL), inner nuclear layer (INL) and
outer plexiform layer (OPL). In comparison to the control group, the expression
level of LC3- II was higher in all the experimental groups (P<0.05),
with the peak expression at 12h after reperfusion. Additionally, the expression
level of p62 was higher in all the experimental groups than the control (P<0.05,
except for group A), with the peak level occurred 24h after reperfusion.
CONCLUSION: Both p62 and LC3 show
low level and uneven expression in the retina of normal adult rats. Acute
ocular hypertension can lead to upregulation of LC3- II and p62 expression in
the retina. Autophagy flux is damaged 12h after reperfusion, potentially
resulting in further loss of RGCs.
KEYWORDS: glaucoma; acute ocular
hypertension; LC3; p62; autophagy
DOI:10.18240/ijo.2020.01.04
Citation: Wu
YY, Zheng BR, Chen WZ, Guo MS, Huang YH, Zhang Y. Expression and role of
autophagy related protein p62 and LC
INTRODUCTION
Glaucoma is the leading cause of
irreversible blindness worldwide, which had been estimated to affect 111
million people by 2040[1]. It is a progressive
neurodegenerative disease characterized by degeneration or loss of retinal
ganglion cells (RGCs) and its axons[2]. Previous
studies have suggested that multiple factors contribute to the irreversible
damage of visual function in glaucoma, among which elevated intraocular
pressure (IOP) has been widely acknowledged as the most important and only modifiable
risk factors for glaucoma[2-4].
However, continued worsening of visual function has been observed in glaucoma
patients with normal IOP[5]. This may be partly
explained by the cascading damage of RGCs caused by initial IOP rising. IOP
elevation could directly affect retinal blood vessels and reduce retinal blood
flow[6]. In addition, the reperfusion injury of
the retina with reducing IOP may lead to further loss of RGCs. However to date,
little is known about the specific mechanisms underlying the association
between high IOP and cell death in the optic nerve. Recent studies suggested
that autophagy was related to photoreceptor degradation and death in glaucoma
pathogenesis.
Autophagy, also known as cell
self-digestion, is a cell-protective process which could be stimulated in
response to varying stressors including oxidative stress[7].
Under normal physiological condition, the intracellular autophagy keep a state
of equilibrium. Once the autophagy balance is broken, autophagy will lose the
ability of protecting cells and result in diseases. The role of autophagy in
RGCs death is controversial in literature. It has been suggested that a certain
level of autophagy can protect the RGCs, while excessively activated or
inhibited autophagy may cause RGCs damage[8-9].
Few studies had reported that autophagy was activated in RGCs after acute IOP
elevation[10]. The number of photoreceptor deaths
decreased significantly with autophagy suppressed in a light damage mouse model[8]. In addition, changes in the level of autophagy can
determine RGCs survival in traumatic optic nerve injury and glaucoma animal
models[5]. Some studies have also confirmed that
excessive activation of autophagy may lead to self-digestion and even cell
death.
Challenge remains to explain the
relationship between autophagy related pathways and glaucoma, and the main
effect of autophagy in glaucoma pathogenesis. The goal of the present study was
to investigate the expression and potential role of autophagy related protein
p62 and LC
SUBJECTS AND METHODS
Ethical Approval All animals were sacrified after the
experiment by intraperitoneal injection of 1% pentobarbital (80 mg/kg). The
sacrificed animals were sent to the local animal center for further disposal.
Animal treatment and care were conducted according to the Association for
Research in Vision and Ophthalmology (ARVO) Statement for the Use of Animals in
Ophthalmic and Vision Research. This research was approved according to
relevant laws and regulations of animal experiment and laboratory animal
welfare committee of the Second Affiliated Hospital of Fujian Medical
University.
Animals Adult Male Sprague-Dawley (SD) rats (220
A total of 50 SD rats were used in
this study and randomly divided into five groups: one control group and four
experimental groups (groups A, B, C, and D). No intervention was administered
in the control group. The right eyes of rats in the experimental groups were
chosen as the experimental eyes in establishment of acute ocular hypertension
model according to the procedure described by Odagiri et al[11]. In brief, the vertical distance between the liquid
lever in infusion bottle and the animal eye was
H&E Staining and Rerinal Ganglion Cells Counting Rats in the
experimental groups were sacrificed at 6h (group A), 12h (group B), 24h (group
C) and 48h (group D) after removal of the infusion needle. The right eyeballs
were enucleated. After 24-hour fixation in 4% paraformaldehyde, dehydration in
graded alcohols, and washing with dimethylbenzene, the specimens were embedded
into paraffin. Histological sections were then prepared on the polylysine
pre-managed slides. The same procedures were applied to the control group. For
each eye, three slices were randomly selected for routine hematoxylin-eosin
staining (H&E), and the micromorphology of retina was evaluated using the
microscope (Japan, SN-MD). Five high power field images for each slide at 400
time were taken using the medical image analysis system (Image J 1.46r,
National Institutes of Health, USA) for RGCs counting (number/field), and the
average of all three slices was calculated and recorded.
Immunohistochemistry The prepared
eyeball slides were cleared using xylene conventionally, endogenous enzymes
inactivation was then administered using 3% hydrogen peroxide and antigen
retrieval. Subsequently, the slides were incubated with primary antibodies
against p62 and LC3 overnight at
Western Blot Analysis Retina
tissue was dissected from the sclera and then immediately homogenized in a
glass-Teflon Potter homogenizer in an ice-cold lysis buffer containing 20
mmol/L Hepes, pH 7.5,10 mmol/L KCl,1.5 mmol/L MgCl2,1 mmol/L
ethylenediaminetetraacetic acid (EDTA), 1 mmol/L ethylene glycol tetraacetic
acid (EGTA), 1 mmol/L DTT, 0.5% CHAPS, complete protease inhibitors. After
1-hour standing, the samples were centrifuged for 20min using the high-speed
refrigerated centrifuge under 12 000 r/min. The supernatant was fully mixed
with the protein sample buffer (5× sample buffer and 20× reducing agent), and
boiled at
Statistical Analysis All data
followed normal distribution and presented as mean±SD. The randomized
controlled single factor intervention multilevel experimental design was
adopted. Homogeneity of data variance in each group was confirmed by Levene’s
test. Differences among groups were compared using one-way ANOVA. Statistical
analyses were performed using SPSS 17 (IBM Corporation, Armonk, NY) with a P
value of <0.05 considered to be statistically significant.
RESULTS
Retina Structure of Normal Rats The H&E
staining images showed well distinguished layers of the retina in normal rats
(Figure 1): the photoreceptor layer (PL) including the rods and cones, the
external limiting membrane (ELM), the outer nuclear layer (ONL) consisting of
8-10 layers of compacted arranged cell nuclei, the outer plexiform layer (OPL),
the inner nuclear layer (INL) composing of 3-5 layers of compacted arranged
cell nuclei, the inner plexiform layer (IPL), the ganglion cell layer (GCL)
which is a regular distributed monolayer, the nerve fiber layer (NFL) and the
internal limiting membrane (ILM).
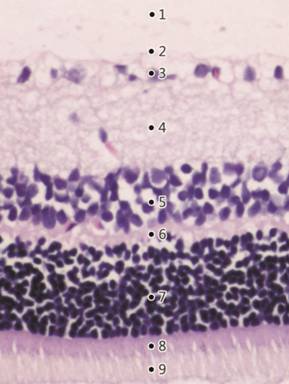
Figure 1 H&E staining of a
normal rat’s retina (×200) showing well distinguished retinal layers 1: The inner limiting membrane
(ILM); 2: The nerve fiber layer (NFL); 3: The ganglion cell layer (GCL); 4: The
inner plexiform layer (IPL); 5: The inner nuclear layer (INL); 6: The outer
plexiform layer (OPL); 7: The outer nuclear layer (ONL); 8: The external
limiting membrane (ELM); 9: The photoreceptor layer (PL).
Retinal Structure of Experimental Rats Figure 2
illustrates the retina H&E staining images in the control and experimental
groups at different time points after reperfusion. The average numbers of RGCs
in each group were presented in Table 1. Six hours after reperfusion (group A),
slightly widening of the retinal tissue space was observed with no obvious
change in the retinal thickness. Twelve hours after reperfusion (group B),
retinal edema developed with irregular arrangement and loosen of cells in the
NFL and IPL, and the number of RGCs decreased significantly as compared to the
control group (percent reduction, 16.9%; P<0.05). At 24h after
reperfusion (group C), thinning of retina was observed, especially for the IPL.
There was no retina edema and number of RGCs further decreased (percent
reduction, 29.2%; P<0.05). The thinning of retina and reduction in
RGCs numbers (percent reduction, 35.4%; P<0.05) was more significant
48h after reperfusion (group D). The average number of RGCs was 19.5±1.03/500 μm in the control group, and showed an overall significant
decreasing trend with prolonged reperfusion time (P<0.01).
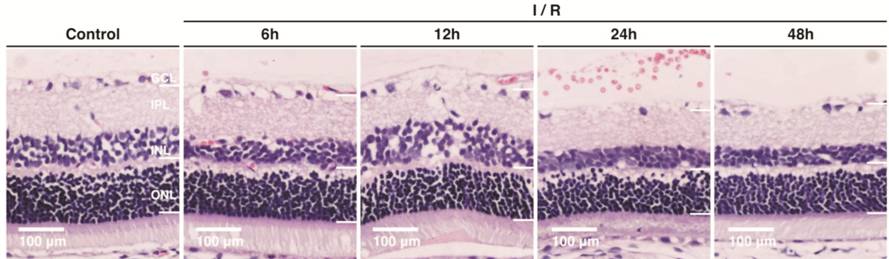
Figure 2 Retinal structure in the
control group and different experimental groups (H&E staining, 200×).
Table 1 Numbers of retinal ganglion
cells in each group
|
Groups |
Number of eyes |
Average RGCs number/500 μm (mean±SD) |
Percentage reduction |
|
Control |
5 |
19.5±1.03 |
|
|
Group A |
4 |
17.6±0.89 |
9.74% |
|
Group B |
5 |
16.2± |
16.9% |
|
Group C |
5 |
13.8± |
29.2% |
|
Group D |
4 |
12.6± |
35.4% |
|
F |
|
110.56 |
|
|
P |
|
<0.01 |
|
aSignificant difference (P<0.05)
between the experimental groups and the control group (one-way ANOVA, LSD
test).
Distribution and Semi-quantitation of LC3 and p62 LC3 mostly
expressed in the GCL in the retina of normal rats (control group). In
comparison, immunohistochemical staining of LC3 was enhanced in all the
experimental groups, and was strongest at 12h after reperfusion (group B;
Figure 3). Semi-quantitative detection of LC3 showed significant differences
between the control group and experimental groups (P<0.05; Figure 4).
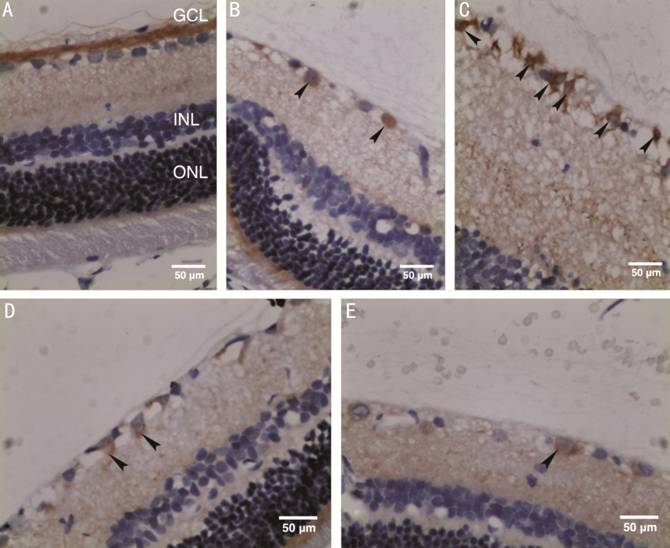
Figure 3 Distribution of LC
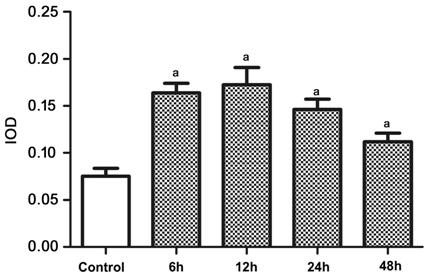
Figure 4 Semi-quantitative expression level of LC
Expression of p62 was found in the
NFL, GCL, IPL, INL and OPL in the control and all experimental groups. p62
staining was enhanced in all the experimental groups as compared to the control
group (Figure 5). The higher p62 expression in experimental groups was
statistically significant as demonstrated by the semi-quantitative analysis (P<0.05;
Figure 6).
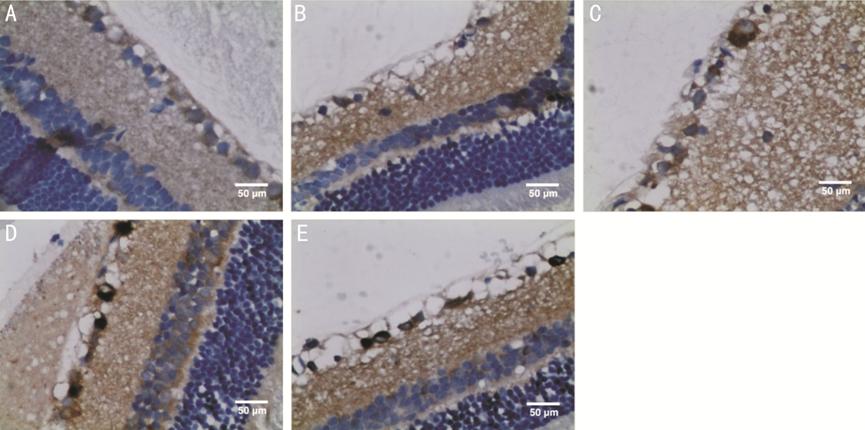
Figure 5 Immunohistochemical
staining images showing p62 as scattered brown particles in NFL, GCL, IPL, INL,
and OPL of retina (400×) A: An image of the retina from the
control group; B: An image of the retina at 6h after reperfusion (group A); C:
An image of the retina at 12h after reperfusion (group B); D: An image of the
retina at 24h after reperfusion (group C); E: An image of the retina at 48h
after reperfusion (group D).
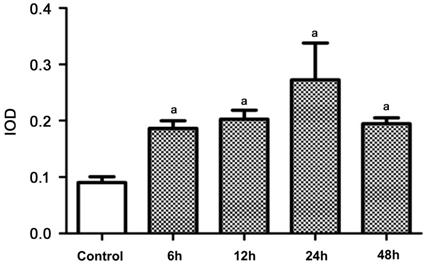
Figure 6 Semi-quantitative
expression level of p
Expression of LC3-II and p62 As shown by
the Western blot analysis, the expression level of LC3-II in the rat retina in
group A was higher than that in the control group (0.095±0.01344 vs
0.02±0.00816, P<0.05; Figure 7). Expression of LC3-II reached the
highest level at 12h after reperfusion (group B), followed by a decreasing
trend with longer reperfusion time. The difference in LC3-II expression between
the experimental groups and the control group was statistically significant (P<0.05).
Meanwhile, the expression of p
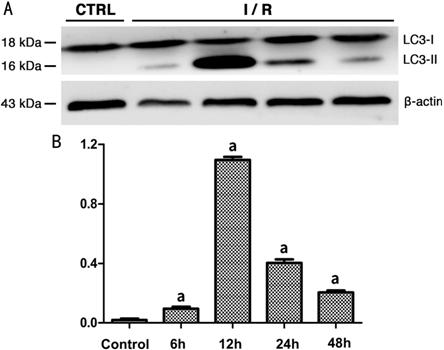
Figure 7 Expression level of LC3-II
in rats’ retina of each group A: Western blot radioactive detected
bands of LC3-I, LC3-II and β-actin; B: The amount of LC3-II in each group after
normalized to β-actin (n=5). aSignificant difference (P<0.05)
between the experimental groups and the control group (one-way ANOVA, LSD
test).
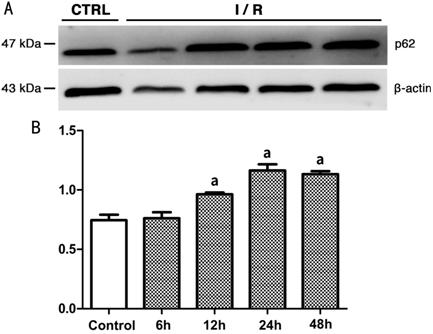
Figure 8 Expression level of p
DISCUSSION
In the present study, we
demonstrated the activation of autophagy and its relationship with RGCs
apoptosis in a rat model of acute ocular hypertension.
By comparing the retina structure
and RGCs numbers between normal rats and rats in different experimental groups,
we found that the degree of neuronal loss was related to the duration of ischemia-reperfusion.
Retina thinning and reduction in RGCs were more obvious with longer reperfusion
time. The underlying mechanisms for cell death after ischemia-reperfusion are
largely unknown. Previous studies have reported that many kinds of programmed
cell death (including cell apoptosis and autophagy) play an important role in
the retina metabolism in glaucoma patients. Autophagy had also been suggested
as a potential cause for RGCs death after retina ischemia-reperfusion (RIR).
Autophagy can be divided into
chaperone-mediated autophagy (CMA), micro-autophagy and macro-autophagy
according to the different combining forms of autophagosome and lysosome[12]. The present study mostly focused on the
process of macro-autophagy. The core function of macro-autophagy is to degrade
long-lived proteins and damaged organelles, thus ensuring the stability of
intracellular environment. During autophagy, the complete organelles (such as
mitochondria) and some cytoplasm are separated into the double layer coating vesicles
to form autophagosomes, which will connect with the lysosomes and form
autophagolysosomes. Finally, the hydrolase in autophagolysosomes degrades
certain substances to reproduce new macromolecular products, which can be
reused by cells[13-14]. A
variety of proteins encoded by the autophagy associated gene (Atg) are
involved in autophagy [10]. Microtubule-
associated protein 1 light chain 3 (LC3) is currently known as the marker
protein of autophagosome[15]. LC3
exists in two forms: LC3-I is usually found in the cytoplasm and LC3-II on the
membrane. LC3- II is a hard-to-degrade protein formed by the binding of LC3-I
with phosphatidyl ethanolamine (PE). Therefore, the expression level of LC3-II
can be used to represent the volume of autophagy[13].
Earlier studies have shown that LC3
was expressed in RGCs and photoreceptors using immunohistochemical staining.
Kim et al[16] reported that the expression
of LC3-II in the RGCs significantly increased on the 1st, 3rd,
5th and 7th day after optic nerve damage and reached the
highest level on the 3rd day based on an optic nerve disconnection
rat model. This indicated that autophagy was activated in RGCs after optic
nerve injury. Rodríguez-Muela et al[8]
observed increased autophagy in RGCs 3-10d after optic nerve injury. In a
chronic intraocular hypertension model, the expression of LC3-II and number of
autophagosome increased at 1-4wk after IOP elevation. Additionally, the
staining of LC3B in the GCL and IPL was also enhanced[9].
In a rat RIR model, Russo et al[17]
reported no significant difference in the LC3-II expression between the normal
retina and retina at 24h after reperfusion. However, another study reported
significantly increased expression of LC3-II at 24h after reperfusion[10]. This discrepancy might be due to difference in IOP
elevation degree. In the present study, LC3 immunoreactive particles was not
found in the retina of normal rats, but found in the GCL in the rats with acute
ocular hypertension with strongest staining at 12h after reperfusion, which was
further confirmed by Western-blot analysis. Thus we suggest that autophagy is
activated in the retina after retina ischemia-reperfusion damage.
The expression of LC3-II could not
reflect the downstream process of autophagy, namely the autophagy flux[13]. Another multiple domain protein p62 is involved in
this process. Therefore, the investigation of autophagy flux requires
simultaneous detection of both p62 and LC3-II. The Phox and Bem1p (PB1) domain,
located at the N end of p62, can attract and combine molecules with certain
structures. Then it combines with LC3 by the LC3-interacting region (LIR) at
the C terminal to accumulate the molecules to be degraded in the
autophagosomes. The expression of p62 increases during the molecular
accumulation process, and decreases as the enzymatic hydrolysis reaction starts[18]. Therefore, the decrease in p62 expression and the
transformation of LC3 into LC3-II is considered to be an important indicator of
autophagy flux. Previous studies have reported that compared with normal
subjects, the level of p
In eukaryotic cells, the
ubiquitin-protease line is a major way of protein metabolism, responsible for
removing short-life proteins, various regulatory proteins, and defective
proteins. Autophagy is responsible for degrading long-life proteins. In the
normal process of growth and development, these two pathways can be
interrelated by p62 to maintain cellular homeostasis. After combining with
ubiquitin, p62 recruits ubiquitinated protein and affects the
ubiquitin-proteasome process. Studies of knockout mice and drosophila models
reported that p62 was the key protein of ubiquitinated protein aggregation[18]. Almost all neurodegeneration-related studies showed
abnormal accumulation of ubiquitinated protein. It has been reported that
inhibition of autophagy in neurons can lead to p62 accumulation and
mitochondrial damage, which potentially lead to neuro-degeneration and nerve
cell death[22]. p62 is also a stress response
protein, which is upregulated with over aggregation of sodium arsenite, cadmium
ion carrier, proteasome inhibition and abnormal proteins[23].
Conversely, the abnormal accumulation of p62 reduces the normal clearance of
cells and leads to excessive accumulation of abnormal substances, posing
detrimental effect to the retina.
The role of autophagy in the
pathogenesis of many neurodegenerative diseases had been demonstrated in
literature. Rapamycin, an autophagy inducer, can prevent A β oligomers from
destroying synapses in rat hippocampal neurons. Salminen et al[24] proposed that the blocking of autophagy would cause
mitochondrial dysfunction, which interfered with the clearance process of
amyloid precursor protein and tau protein. These findings suggest that
regulation of autophagy may delayed the progression of neurodegenerative
diseases. It is reported RGC-5 cells can induce autophagy activation to protect
themselves under starvation states in vitro[25].
Autophagy inducers, such as Rapamycin, may reduce the concentration of reactive
oxygen species and increase cell viability in RGC-5 cells. Meanwhile, autophagy
inhibitors play an opposite role in RGC-5 cells. Therefore, it is suggested
that autophagy regulation can help improve the ability of RGCs to resist
harmful external environment.
Few studies had investigated the
expression and role of LC3 and p
In conclusion, acute ocular
hypertension could lead to upregulation of LC3- II and p62 expression in the
retina. Autophagy flux was detected 12h after reperfusion, potentially
resulting in further loss of RGCs. More autophagy related proteins need to be
investigated in the future to explore the relationship between various
regulatory pathways of autophagy and glaucomatous optic neuropathy to explore
new therapeutic methods.
ACKNOWLEDGEMENTS
Authors’ contributions: Wu YY conceived of the study,
participanted in the study design and drafted the manuscript. Zheng BR
participanted in the study design, carried out the experiments and drafted the
manuscript. Chen WZ, Huang YH and Zhang Y helped to perform the experiments and
to modify the manuscript; Guo MS conceived of the study and participanted in
its design. All authors read and approved the final manuscript.
Foundation: Supported by the Natural Science
Foundation of Fujian Province (No. 2016J01525).
Conflicts of Interest: Wu YY, None; Zheng BR,
None; Chen WZ, None; Guo MS, None; Huang YH, None; Zhang
Y, None.
REFERENCES