
��Clinical Research��
Accuracy
of biometric formulae for intraocular lens power calculation in a teaching
hospital
Kevin
S Tang1,2, Elaine M Tran1,2, Allison J Chen2,3,
David R Rivera1,2, Jorge J Rivera1,2, Paul B Greenberg1,2
1Division of Ophthalmology, Alpert
Medical School, Brown University, Providence 02903, Rhode Island, USA
2Section of Ophthalmology, Providence
VA Medical Center, Providence 02908, Rhode Island, USA
3Shiley Eye Institute and Department
of Ophthalmology, University of California San Diego, La Jolla 92093,
California, USA
Correspondence to: Paul B Greenberg. Section of
Ophthalmology, Providence VA Medical Center, 830 Chalkstone Ave, Providence, RI
02908, USA. paul_greenberg@brown.edu
Received:
Abstract
AIM: To evaluate the
accuracy of three commonly used biometric formulae across different axial
lengths (ALs) at one United States Veterans Affairs teaching hospital.
METHODS: A retrospective chart
review was conducted from November 2013 to May 2018. One eye of each patient
who underwent cataract surgery with a monofocal intraocular lens (IOL) was
included. The range of postoperative follow-up period was from 3wk to 4mo. The
Holladay 2, Barrett Universal II, and Hill-Radial Basis Function (Hill-RBF)
formulae were used to predict the postoperative refraction for all cataract
surgeries. For each formula, we calculated the prediction errors [including
mean absolute prediction error (MAE)] and the percentage of eyes within ��0.25
diopter (D) and ��0.5 D of predicted refraction. We performed subgroup analyses
for short (AL<
RESULTS: A total of 1131
patients were screened, and 909 met the inclusion criteria. Resident
ophthalmologists were the primary surgeons in 710 (78.1%) cases. We found no
statistically significant difference in predictive accuracy among the three
formulae over the entire AL range or in the short, medium, and long eye
subgroups. Across the entire AL range, the Hill-RBF formula resulted in the
lowest MAE (0.384 D) and the highest percentage of eyes with postoperative
refraction within ��0.25 D (42.7%) and ��0.5 D (75.5%) of predicted. All three
formulae had the highest MAEs (>0.5 D) and lowest percentage within ��0.5 D
of predicted refraction (<55%) in short eyes.
CONCLUSION: In cataract surgery
patients at our teaching hospital, three commonly used biometric formulae
demonstrate similar refractive accuracy across all ALs. Short eyes pose the
greatest challenge to predicting postoperative refractive error.
KEYWORDS: cataract surgery;
biometry; intraocular lens; power calculation
DOI:10.18240/ijo.2020.01.09
Citation: Tang
KS, Tran EM, Chen AJ, Rivera DR, Rivera JJ, Greenberg PB. Accuracy of biometric
formulae for intraocular lens power calculation in a teaching hospital. Int
J Ophthalmol 2020;13(1):61-65
INTRODUCTION
Cataract surgery is one of the most
frequently performed procedures in the Veterans Health Administration, the
largest integrated health care system and the largest provider of health care
training in the United States (US)[1]. Advances in
optical biometry and intraocular lens (IOL) power formulae have led to
continued improvements in postoperative refractive outcomes[2-3]: in 2017, 97.3% of cataract surgeries were within ��1
diopter (D) of predicted postoperative refraction[4].
Determining the postoperative effective lens position (ELP) and better accounting
for the role of axial length (AL) remain challenges to further improvements in
the accuracy of preoperative biometry[2,5].
While studies done in the past five
years have generally found the Barrett Universal II formula to be most accurate[4,6-9], the relative
accuracy of different formulae is dependent on a multitude of factors,
including AL[4,7,9-10], the type of biometry used [optical low-coherence
reflectometry (OLCR) versus partial coherence interferometry (PCI)][11], preoperative anterior chamber depth (ACD) values[12], and interocular AL and corneal power differences[13].
Evaluating biometric accuracy in a
teaching hospital setting is important as this is where residents are learning
their approach to patient care. In teaching hospitals, refractive outcomes may
be impacted not only by resident surgeons with variable experience[14-15], but also different personnel
who may perform biometry and refractions[16].
However, the few studies published within the last five years in teaching
hospitals are limited by size (<300 patients) or focus (eyes with AL>
SUBJECTS AND METHODS
Ethical Approval All study conduct adhered to the tenets
of the Declaration of Helsinki. Because of its retrospective nature, the
requirement of informed consent was waived. The Providence Veterans Affairs
Medical Center (PVAMC) Institutional Review Board approved this retrospective
study. The Holladay 2, Barrett Universal II, and Hill-Radial Basis Function
(Hill-RBF, first version) formulae were used to predict the postoperative
refraction for all cataract surgeries. We did not include older formulae such
as the SRK-T and Hoffer Q in our analysis as prior studies have demonstrated
the superiority of current generation formulae[2,4,7,11]. Optical
biometry was performed using the Lenstar optical biometer (Haag-Streit USA,
Mason, OH, USA). We included patients who received cataract surgery using
monofocal spherical SN60WF IOLs at the PVAMC teaching hospital between November
2013 and May 2018. Only one eye was included from each patient to prevent
compounding of data with the use of bilateral eyes; correlation between
outcomes between a patient��s two eyes would decrease the power of the study[17]. Furthermore, as not all cataract patients at the
PVAMC received bilateral surgery, including both eyes from eligible patients
would have disproportionately weighted outcomes from these patients. If a
patient had cataract surgery in both eyes, we included the eye with the better
postoperative best corrected visual acuity (BCVA) in the study as refraction
accuracy decreases with worsening BCVA[17]. If
both eyes had the same postoperative BCVA, we included the earlier cataract
surgery[4]. These inclusion criteria are based on
recommendations by Hoffer et al[17] for
optimized study protocol in examining IOL formula accuracy. Patients were
excluded if they had no postoperative refraction within 3wk to 4mo[4,11], AL or lens thickness
(LT) not measurable by optical biometry, history of corneal disease, history of
refractive surgery, posterior capsular rupture, sulcus IOL, or BCVA worse than
20/40.
Information extracted from patient
charts included patient age, race, ethnicity, gender, pupil size, prior
cataract surgery, preoperative refraction, preoperative BCVA, postoperative
refraction, postoperative BCVA, IOL type, and IOL power. Preoperative and
postoperative refractive values were recorded in spherical equivalents. The
preoperative biometry and the majority of the postoperative refractions were
performed by experienced technicians certified by the Joint Commission on
Allied Health Personnel in Ophthalmology[18].
Information extracted from the
Lenstar device included AL, ACD, preoperative flat corneal front power (K1),
preoperative steep corneal front power (K2), LT, horizontal white-to-white
(WTW) corneal diameter, and central corneal thickness (CCT). Predicted
postoperative refractions from the Barrett Universal II and Hill-RBF formulae
were extracted from the Haag-Streit EyeSuite software. Predictive measurements
from the Holladay 2 formula were extracted from the Holladay IOL Consultant
program.
We plotted overall refractive
outcomes and calculated mean prediction error (ME), mean absolute prediction
error (MAE), median absolute prediction error (MedAE), and the percentage of
eyes with a prediction error of ��0.25 D and ��0.5 D for each formula. The MAE
and MedAE provided a glimpse into the overall accuracy of each formula, while
the ME showed whether each formula tends to produce more negative or positive refractive
outcomes than predicted. These conventions follow those established by prior
studies[4,7,11].
Statistical comparisons of MAE among the three formulas were performed using
one-way repeated measures analysis of variance (Friedman test). Subgroup analyses
for short (AL<
RESULTS
A breakdown of patient demographics
can be found in Table 1. Out of 1131 total charts reviewed in the study period,
we included 909 eyes from 909 patients in the final study; 170 patients were
excluded due to lack of postoperative refraction within the designated
follow-up period, 33 for worse than 20/40 postoperative BCVA (27 had
pre-existing ocular disease), 14 for complications, and five for missing data.
Resident ophthalmologists were the primary surgeons in 78.1% (710/909) of the
cases.
Table 1 Demographics of patients
n=909, n (%)
|
Demographics |
Data |
|
Left eye |
444 (49) |
|
Female |
21 (2.3) |
|
Race |
|
|
Asian |
2 (0.2) |
|
Black |
32 (3.5) |
|
White |
855 (94) |
|
Other |
20 (2.2) |
|
Ethnicity |
|
|
Hispanic or Latino |
4 (0.4) |
|
Not Hispanic or Latino |
897 (99) |
|
Unknown |
8 (0.9) |
|
Axial length subgroups |
|
|
Short, < |
16 (1.8) |
|
Medium, 22.0 |
762 (84) |
|
Long, > |
125 (14) |
|
Age, y (mean��SD) |
74.5��0.26 |
|
Preoperative refraction (25%tile,
median, 75%tile) |
-2.125, -0.375, 1.125 |
|
Postoperative refraction (25%tile,
median, 75%tile) |
-0.5, -0.25, 0.0 |
|
IOL power (mean��SD) |
20.6��2.8 |
|
Anterior chamber depth, mm
(mean��SD) |
3.2��0.43 |
|
Lens thickness, mm (mean��SD) |
4.61��0.50 |
|
Preoperative flat corneal front
power, K1 (mean��SD) |
43.1��1.52 |
|
Preoperative steep corneal front
power, K2 (mean��SD) |
43.8��1.75 |
|
Horizontal white-to-white corneal
diameter, mm (mean��SD) |
12.2��0.51 |
|
Central corneal thickness, ��m
(mean��SD) |
547��38 |
SD: Standard deviation; IOL:
Intraocular lens.
Overall refractive outcomes are
displayed in Figure 1 and prediction error data for all AL subgroups are found
in Table 2. While the Hill-RBF formula had the lowest MAE across the entire AL
range, one-way analysis of variance showed no significant difference among the
three formulae for monofocal IOL implantation (F=0.37, P=0.69).
The Hill-RBF also predicted the highest percentage of eyes with postoperative
refraction within ��0.25 D (42.5%) and ��0.5 D (75.5%) across the entire AL
range.
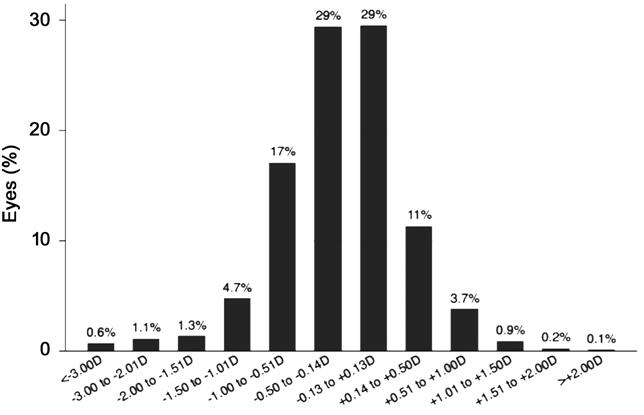
Figure 1 Bar graph of the
distribution of refractive outcomes for the SN60WF model intraocular lens.
Table 2 Prediction errors in
different AL groups (n=909)
|
Formula |
MAE (D) |
MedAE (D) |
ME (D) |
SD |
Percentage of eyes within diopter range indicated |
|
|
��0.25 D (%) |
��0.5 D (%) |
|||||
|
Entire AL range (n=909, F=0.37,
P=0.69) |
||||||
|
Barrett 2 |
0.397 |
0.300 |
-0.0760 |
0.564 |
41.8 |
74.1 |
|
Holladay 2 |
0.399 |
0.310 |
0.0661 |
0.570 |
40.6 |
71.2 |
|
Hill-RBF |
0.384 |
0.300 |
-0.0023 |
0.554 |
42.7 |
75.5 |
|
Short eyes (n=16, F=0.02,
P=0.97) |
||||||
|
Barrett 2 |
0.535 |
0.470 |
0.137 |
0.669 |
26.7 |
53.3 |
|
Holladay 2 |
0.512 |
0.480 |
0.115 |
0.672 |
37.5 |
50.0 |
|
Hill-RBF |
0.502 |
0.410 |
0.057 |
0.664 |
46.7 |
53.3 |
|
Medium eyes (n=762, F=0.28,
P=0.75) |
||||||
|
Barrett 2 |
0.376 |
0.285 |
-0.060 |
0.517 |
42.8 |
76.4 |
|
Holladay 2 |
0.384 |
0.302 |
0.055 |
0.527 |
41.4 |
72.7 |
|
Hill-RBF |
0.370 |
0.295 |
0.015 |
0.517 |
43.0 |
77.6 |
|
Long eyes (n=125, F=0.08,
P=0.91) |
||||||
|
Barrett 2 |
0.507 |
0.355 |
-0.203 |
0.772 |
37.9 |
62.9 |
|
Holladay 2 |
0.483 |
0.368 |
0.130 |
0.785 |
36.4 |
65.3 |
|
Hill-RBF |
0.474 |
0.335 |
-0.174 |
0.763 |
39.8 |
62.5 |
AL: Axial length; MAE: Mean absolute
prediction error; MedAE: Median absolute prediction error; ME: Mean prediction
error; SD: Standard deviation; Hill-RBF: Hill-Radial Basis Function.
The outcomes for short, medium, and
long AL subgroups were similar: no statistically significant differences were
found among the three formulae for all three subgroups (P=0.97, 0.75,
and 0.91 for short, medium, and long ALs, respectively). The Hill-RBF formula,
however, consistently had the lowest MAE across all eye lengths. All three
formulae produced their highest respective MAEs in the short AL subgroup:
Holladay 2 had a MAE of 0.512 D, Hill-RBF had one of 0.502 D, and Barrett
Universal II had one of 0.535 D. The Hill-RBF and Barrett also produced the
lowest percentage of eyes in the short AL subgroup with postoperative refraction
within ��0.25 and ��0.5 D. Conversely, all three formulae produced their most
accurate results in the medium AL subgroup: Holladay 2 had an MAE of 0.384 D,
Hill-RBF had one of 0.370 D, and Barrett Universal II had one of 0.376 D. All
three formulae produced their highest percentage of eyes with postoperative
refraction within ��0.25 and ��0.5 D in the medium AL subgroup.
DISCUSSION
To our knowledge, this is the
largest study to date comparing the accuracy of biometric formulae in cataract
surgery in a teaching hospital setting. In our current sample size, we found no
statistically significant difference between Holladay 2, Hill-RBF, and Barrett
Universal II biometric formulae across multiple ALs. Kane et al[8] found that the Hill-RBF formula had a significantly
lower MAE than the Barrett Universal II in short eyes, and that the Hill-RBF
performed better in long eyes than in medium eyes. In our analysis, the
Hill-RBF retained the lowest MAE for the entire AL range, though this was not
statistically significant, most likely due to the smaller size of our study
relative to that of Kane et al[8] (n=3241).
In addition, we found that all three formulae produced their highest MAE in the
short AL subgroup. This was consistent with previous studies that stratified predictive
errors according to AL (Table 3)[10-11].
Table 3 Previous studies comparing
biometric formulae
|
Study |
No. of eyes |
Formulae |
MAE (D) |
Conclusions |
|||
|
Overall |
Short AL |
Medium AL |
Long AL |
||||
|
Melles et al, 2018[4] |
13301 |
Barrett 2 |
0.311 |
- |
- |
- |
Barrett was most consistently accurate in different
AL groups |
|
Holladay 2 |
0.450 |
- |
- |
- |
|||
|
Kane et al, 2017[8] |
3122 |
Barrett 2 |
0.381 |
0.451 |
0.383 |
0.375 |
Hill-RBF was more accurate than Barrett in short AL
group; the Barrett was more accurate overall and in medium ALs |
|
Holladay 2 |
0.410 |
- |
- |
- |
|||
|
Hill-RBF |
0.407 |
0.423 |
0.412 |
0.373 |
|||
|
Cooke et al, 2016[11] |
1454 |
Barrett 2 |
0.306 |
0.338 |
- |
0.274 |
All formulae were least accurate for short eyes |
|
Holladay 2 |
0.346 |
0.426 |
- |
0.394 |
|||
|
Gökce et al, 2017[2]a |
86 |
Barrett 2 |
- |
0.39 |
- |
- |
Only short eyes were analyzed; no statistically
significant difference in formula accuracy |
|
Holladay 2 |
- |
0.40 |
- |
- |
|||
|
Hill-RBF |
- |
0.36 |
- |
- |
|||
|
Gökce et al, 2018[12]a |
270 |
Barrett 2 |
0.29 |
- |
- |
- |
Compared formulae accuracy for patient groups with
varying ACD; Barrett had lowest MAE for ACD< |
|
Holladay 2 |
0.31 |
- |
- |
- |
|||
|
Hill-RBF |
0.28 |
- |
- |
- |
|||
|
Carifi et al, 2015[21] |
28 |
Holladay 2 |
- |
0.82 |
- |
- |
Only short eyes; no difference between formulae,
but all with large MAE |
|
Kane et al, 2016[7] |
3241 |
Barrett 2 |
0.385 |
0.469 |
0.386 |
0.435 |
All formulae were less accurate in short AL group;
Barrett was most accurate for all other ALs |
|
Holladay 2 |
0.420 |
0.466 |
0.416 |
0.544 |
|||
MAE: Mean absolute prediction error;
ACD: Anterior chamber depth; AL: Axial length; D: Diopters; Hill-RBF:
Hill-Radial Basis Function. aStudy performed in a teaching hospital.
Only two previous studies by Gökce et
al[2,12] were done in a
teaching hospital, but they were both limited by their small sample sizes and
focus on short eyes (Table 3). These two studies did not evaluate the accuracy
of the Holladay 2 or Hill-RBF formulae, but our MAE for the Barrett Universal
II was consistent with theirs[2]. Our MAEs for
each of the formulae were also consistent with values demonstrated in previous
non-teaching hospital studies (Table 3)[4,8,11]. While this is not a one-to-one comparison between
resident and attending surgical outcomes, it is a realistic representation of
the differences between teaching (where a percentage of cases will still be
performed by attending physicians) and non-teaching hospital settings.
This study has several limitations.
First, we targeted patients receiving care in the Veterans Affairs teaching
hospital; hence, our findings may not be generalizable to patients receiving
cataract surgery elsewhere, including other teaching hospitals[19]. Second, our sample size may have precluded achieving
statistically significant differences among the three biometric formulae.
However, our findings confirm that the overall accuracy of biometric formulae
in predicting refractive outcomes are comparable between teaching and
non-teaching hospital settings. Third, we excluded 18.3% of patients due to
lack of postoperative refractive follow-up within the designated timeframe.
Some patients may have followed up with providers outside of the PVAMC, but
others may have neglected to come to follow-up appointments due to satisfactory
postoperative visual outcomes; this may have resulted in selection bias toward
patients with worse refractive outcomes[4,20].
In conclusion, this study found no
difference in the accuracy of the Holladay 2, Hill-RBF, and Barrett Universal
II formulae for cataract surgery in a US teaching hospital, although all three
formulae were least accurate in short eyes.
ACKNOWLEDGEMENTS
Presented at the American Society of
Cataract and Refractive Surgery (ASCRS) Annual Meeting, San Diego, CA USA�C May
2019.
Conflicts of Interest: Tang KS, None; Tran EM, None; Chen
AJ, None; Rivera DR, None; Rivera JJ, None; Greenberg PB,
None.
Disclaimer: The views expressed in this article
are those of the authors and do not necessarily reflect the position or policy
of the United States Department of Veterans Affairs or the United States
government.
REFERENCES