
・Clinical Research・
Comparison
of OCT and OCTA manifestations among untreated PCV, neovascular AMD, and CSC in
Chinese population
Ming-Zhen
Yuan, Lu-Lu Chen, Jing-Yuan Yang, Ming-Yue Luo, You-Xin Chen
Department of Ophthalmology, Peking Union Medical College
Hospital, Chinese Academy of Medical Sciences and Peking Union Medical College,
Beijing 100730, China
Correspondence to: You-Xin Chen. Department of Ophthalmology, Peking Union
Medical College Hospital, Chinese Academy of Medical Sciences and Peking Union
Medical College, Beijing 100730, China. chenyx@pumch.cn
Received:
Abstract
AIM: To compare the
qualitative and quantitative features among untreated polypoidal choroidal
vasculopathy (PCV), neovascular age-related macular degeneration (nv-AMD) and
central serous chorioretinopathy (CSC) using optical coherence tomography (OCT)
and OCT angiography (OCTA).
METHODS: This retrospective
study included 16 eyes with thin-choroid PCV, 18 eyes with thick-choroid PCV,
16 eyes with nv-AMD and 17 eyes with CSC, respectively. The indicators were
obtained by OCT and OCTA.
RESULTS: Sub-foveal choroidal
thickness (SFCT) in CSC was thicker compared to other groups (all P<0.05).
SFCT in nv-AMD was thicker compared to thin-choroid PCV, but thinner compared
with thick-choroid PCV (both P<0.05). As the ratio of thickness of
Haller’s layer to thickness of SFCT, which of thin-choroid PCV was
significantly higher than CSC (P<0.001). Likewise, thick-choroid PCV
had significantly higher ratio than nv-AMD (P=0.016) or CSC (P<0.001).
There were differences among them in pigment epithelium detachment (PED). The
whole-superficial retinal vessel density (RVD), deep RVD and choroidal
capillary vessel density (CCVD) in CSC were significantly higher compared to
other three groups, respectively (all P<0.05). The whole CCVD in
nv-AMD was higher compared to thick-choroid PCV (P=0.032).
Cross-sectional local angiographic form was 87.50%, 83.33%, 0 and 35.29% in
thin-choroid PCV, thick-choroid PCV, nv-AMD and CSC, respectively.
Cross-sectional diffuse angiographic form was 12.50%, 16.67%, 100% and 5.88% in
thin-choroid PCV, thick-choroid PCV, nv-AMD and CSC, respectively.
CONCLUSION: Combination of OCT and
OCTA can effectively observe the significant alterations existed in PCV, CSC
and nv-AMD, and there are distinctive differences among them. The pathogenesis
is not exactly the same between PCV and nv-AMD, or PCV and CSC.
KEYWORDS: polypoidal choroidal
vasculopathy; neovascular age-related macular degeneration; central serous
chorioretinopathy; Haller’s layer; vascular density; pigment epithelium
detachment
DOI:10.18240/ijo.2020.01.14
Citation:
Yuan MZ, Chen LL, Yang JY, Luo MY, Chen YX. Comparison of OCT and OCTA
manifestations among untreated PCV, neovascular AMD, and CSC in Chinese
population. Int J Ophthalmol 2020;13(1):93-103
INTRODUCTION
Polypoidal choroidal vasculopathy
(PCV) is a retinal disease initially described by Yannuzzi et al[1] in 1982. It is a common choroidal vascular disease and
the prevalence is higher in Asians than in Caucasians[2-3]. In the early nineties, some experts started regarding
PCV as a subtype of neovascular age-related macular degeneration (nv-AMD) or as
a specific idiopathic entity[4-5].
Until now, whether PCV a variant of nv-AMD or not is still controversial, and
the pathogenesis of PCV is still unknown.
Recently, with advances in imaging
technology, some researchers have proposed the term “pachychoroid” to describe
a spectrum of disease that has the features of choroidal thickening, such as
PCV, central serous chorioretinopathy (CSC), pachychoroid pigment epitheliopathy,
pachychoroid neovasculopathy, and peripapillary pachychoroid syndrome. However,
different from other pachychoroid diseases, PCV have a wide range of choroidal
thickness and the choroidal thickness does not always thicken in PCV[6]. In addition, PCV occurring in eyes that lacks typical
characteristics of nv-AMD, may be a member of the pachychoroid disease
spectrum, which indicates that pachychoroid features may be related to the
pathogenesis of PCV in pachychoroid eyes[6-7].
Plus, many literatures pointed out that the history of CSC is much more
commonly seen in eyes with PCV compared with those with nv-AMD[8]. Therefore, more and more researchers focus on studying
the relationship among PCV, nv-AMD and CSC, especially imaging studies[6,9-10]. Some researchers
believed that choroidal vascular changes accompany the processes of PCV, nv-AMD
and CSC. Last year, a previous study by Baek et al[9]
demonstrated that there were similarities in vascular density of the large
choroidal vessel layer and pachyvessel pattern between CSC and thick-choroid
PCV and between nv-AMD and thin-choroid PCV, which implies these three diseases
may share common pathophysiology involving choroidal changes.
Optical coherence tomography
angiography (OCTA) is a recently advanced noninvasive imaging technique that
could generate retinal and choroidal quantify vessel density and blood flow[11]. Many studies illustrated that OCTA would be capable
of localizing the site at which a feeder vessel, derived from the choroid or
breaking through Bruch’s membrane (BM), as well as would provide quantitative
assessment with metrics of vessel density, vessel connectivity, which may
provide new insight into the pathogenesis of choroidal neovascularization (CNV)[11-13]. Recently, Kang et al[14] demonstrated the potential possibilities and
advantages of using OCTA to assess pigment epithelium detachment (PED) features
and detect the presence of neovascular (NV) in PED. However, no data are
available to reveal the relationship among these three diseases in OCTA
manifestations. Therefore, the purpose of this study analyze them the features
qualitatively and quantitatively using OCTA in eyes with untreated PCV, nv-AMD
and CSC.
SUBJECTS AND METHODS
Ethical Approval This cross-sectional study was
performed at the Department of Ophthalmology in Peking Union Medical College
Hospital, Chinese Academy of Medical Sciences in China. The study was approved
by the Institutional Review Board of Peking Union Medical College Hospital,
which allowed recruitment of patients, review of clinical charts, and the
acquisition of OCTA scans performed in a 6×
Enrollment of Study Subjects We recruited untreated patients with
PCV, nv-AMD and CSC who visited our hospital between August 2018 and February
2019. All patients had a standardized history, clinical examination and
underwent fluorescein angiography (FA) and indocyanine green angiogram (ICGA)
performed with the Heidelberg Spectralis HRA (Heidelberg Engineering,
Heidelberg, Germany). Eyes included in the study had a clinical diagnosis of
PCV, nv-AMD and CSC based on the clinical history, fundoscopic examination,
OCT, FA and ICGA. Study eyes had not received any previous therapy [laser,
photodynamic therapy, or anti-vascular endothelial growth factor (VEGF)] treatment.
We divided PCV into two groups according to the sub-foveal choroidal thickness
(SFCT) for analyzing the choroidal characteristics of subtypes. Median SFCT
(244.5 μm) was used as the cut-off value. Exclusion criteria were as follows:
1) eyes with CNV caused by other than these diseases; 2) any history of
previous treatments such as laser photocoagulation, photodynamic therapy,
intraocular anti-VEGF therapy, and corticosteroids treatment; 3) other ocular
diseases including high myopia (<-6 diopter or axial length >
Image Acquisition and Analysis The quantitative features, like
thickness and height, were measured using the horizontal and vertical line
scans intersecting the center of the fovea on enhanced depth imaging mode of
Spectralis spectral-domain OCT (EDI-OCT). Based on these scans, SFCT was
defined as the distance from the BM to the choroid-scleral interface at the
fovea after binarization analysis in MATLAB[15]
(Figure 1). The SFCT was defined as the distance between the hyperreflective
line of BM and the innermost hyperreflective line of the choroid-scleral
interface[16]. We defined the thickness of
Haller’s layer as the distance from the innermost point of the largest
choroidal vessel closest to the fovea to the inner border of the sclera after
binarization analysis in MATLAB[16] (Figure 1).
And then we calculated the ratio of thickness of Haller’s layer to thickness of
SFCT. Three independent retinal specialists (Yuan MZ, Chen LL and Yang JY)
measured these parameters. Furthermore, the whole-superficial retinal vessel
density (RVD), the whole-deep RVD and the whole choroidal capillary vessel
density (CCVD) were automatically generated by OCTA. Fovea avascular zone (FAZ)
was round and intact with a well-demarcated border in retina, which was also
measured using OCTA. FAZ perimeter (PERIM) was calculated in base of FAZ. Then
we obtained an automated contour evaluation using the built-in “non-flow” area
calculator. Each patient underwent two examinations, and finally we took the
average value as the measurement result.
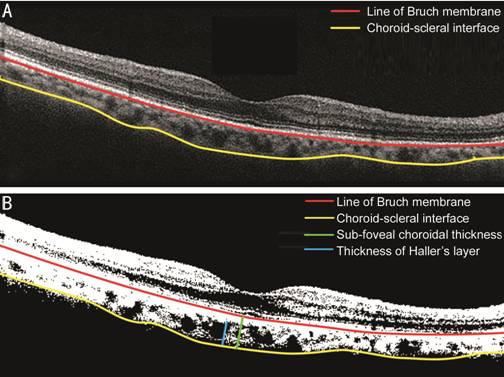
Figure 1 Image binarization for
subfoveal choroid A: The image acquired by EDI-OCT; B:
Visualization of choroid morphologic and parameters obtained by our
custom-written application on MATLAB on image acquired by EDI-OCT.
The qualitative features, like PED
subtype classifications and cross-sectional OCTA classifications, were measured
using the horizontal cross-sectional scan. Based on the guidelines provided by
Lee et al[17], PEDs were classified
independently by three subtypes, including drusenoid PEDs, serous PEDs and
vascularized PEDs. As for vascularized PEDs, we defined a “peaked” PED to describe
the vascularized having a sharp peak on OCT, and a “flat” PED to describe a
shallow and irregular on OCT. In addition to that, drusenoid PEDs were
identified as areas of RPE elevation, typically smooth in contour and with
medium to high, but homogenous, internal reflectivity. Serous PEDs were
identified as localized, relatively dome-shaped elevations of the RPE band with
low internal reflectivity within the PED (optically empty) and good
visualization of the underlying BM band and choroid. Representative images of
each PED subtype were shown in Figure 2. Besides, we classified the horizontal
cross-sectional scans of OCTA into two forms, including cross-sectional local
angiographic form and cross-sectional diffuse angiographic form[18]. As for cross-sectional local angiographic form, one
of which was nodular form and another of which was cluster form. Representative
images of the horizontal cross-sectional scans on OCTA were shown in Figure 3.
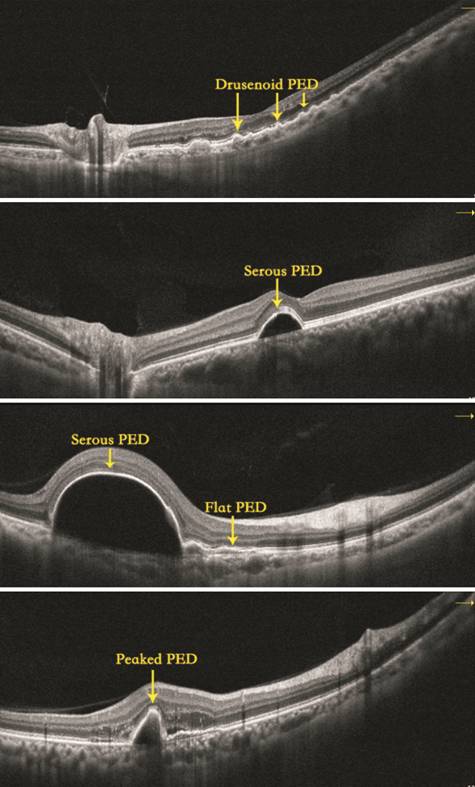
Figure 2 PED subtype
classifications, including drusenoid PED, serous PED, flat PED and peaked PED.
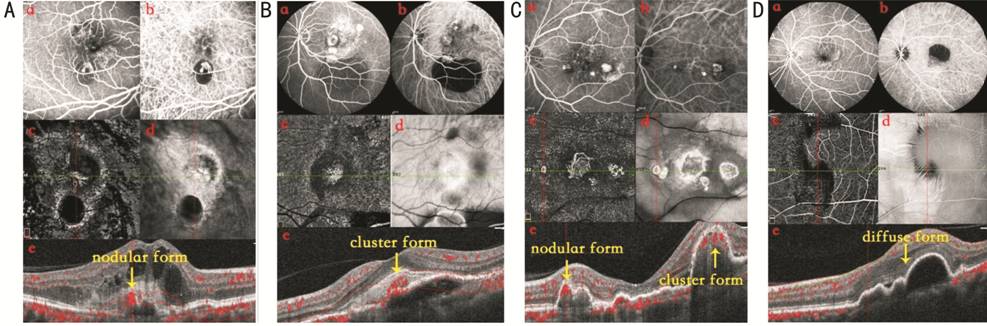
Figure 3 Representative images of
the horizontal cross-sectional scans on OCTA A: One PCV patient, there is nodular
cross-sectional angiographic form on OCTA; B: One PCV patient, there is cluster
cross-sectional angiographic form on OCTA; C: One PCV patient, there are both
nodular and cluster cross-sectional angiographic form on OCTA; D: One nv-AMD
patient, there is diffuse cross-sectional angiographic form on OCTA. a:
Fluorescein angiography; b: Indocyanine green angiogram; c: OCTA; d: Enface
form. e: Cross-sectional angiographic form.
Statistical Analysis Statistical analysis was performed
with SPSS statistical software (version 22.0; SPSS Inc., Chicago, IL, USA). The
Student’s t-test and one-way analysis of variance (ANOVA) for continuous
variables among and between groups after normal distribution confirmation using
the Kolmogorov-Smirnov test. Mann-Whitney tests were used when a normal
distribution could not be confirmed. Chi-square test was used to compare the
categorical parameters. The coefficient of correlation was determined by
Pearson’s correlation analysis. A P value <0.05 was considered
statistically significant.
RESULTS
In this study, we imaged a total of
67 eyes of 65 patients for analysis, 34 eyes with PCV, 16 eyes with nv-AMD, and
17 eyes with CSC. All of these patients were Chinese and treatment naïve. The
mean age of patients with PCV was 64.27±7.83y (range, 49-82y), and 22 (64.71%)
patients were male. The patients with nv-AMD (68.68±9.38y) were significantly
older than those with PCV (P=0.032). The mean age of patients with CSC
(42.26±9.39y) was younger compared with other two groups (both P<0.05;
Table 1, Figure 4). There was no significant difference in gender. As for PCV,
SFCT was >244.5 μm in 18 eyes (thick-choroid PCV) and ≤244.5 μm in 16 eyes
(thin-choroid PCV). The mean SFCT was 196.45±43.85 μm, 309.16±47.50 μm,
246.41±83.08 μm, and 376.78±103.57 μm, in thin-choroid PCV, thick-choroid PCV,
nv-AMD, and CSC. SFCT in CSC was thicker compared to other groups (all P<0.05).
SFCT in nv-AMD was thicker than thin-choroid PCV, but thinner than
thick-choroid PCV (both P<0.05; Table 1, Figure 5).
Table 1 Baseline characteristics and
choroidal morphologic parameters in eyes with thin-choroid PCV, thick-choroid
PCV, nv-AMD and CSC
|
Items |
Thin-choroid PCV (SFCT≤244.5 μm, n=16) |
Thick-choroid PCV (SFCT>244.5 μm, n=18) |
nv-AMD (n=16) |
CSC (n=17) |
|
Age, y |
66.27±8.13 |
63.84±7.24 |
68.68±9.38 |
42.26±9.39 |
|
Gender, male/female (male %) |
10/6 (62.5) |
12/6 (66.67) |
11/5 (68.75) |
11/6 (64.71) |
|
SFCT, μm |
196.45±43.85 |
309.16±47.50 |
246.41±83.08 |
376.78±103.57 |
|
The ratio of Haller’s layer thickness to SFCT, % |
0.84±0.06 |
0.86±0.06 |
0.78±0.13 |
0.72±0.11 |
|
PEDs subtypes, n (%) |
|
|
|
|
|
Drusenoid PED |
3 (18.8) |
3 (16.7) |
9 (56.3) |
2 (11.8) |
|
Serous PED |
9 (56.3) |
9 (50) |
4 (25) |
15 (88.2) |
|
Peaked PED |
4 (25) |
5 (27.8) |
8 (50) |
4 (23.5) |
|
Flat PED |
14 (87.5) |
17 (94.4) |
11 (68.6) |
2 (11.8) |
|
Quantitative data in OCTA |
|
|
|
|
|
Whole superficial RVD, % |
46.05±4.43 |
43.67±3.73 |
41.84±4.40 |
50.60±2.87 |
|
Whole deep RVD, % |
45.86±3.62 |
44.43±5.26 |
43.85±4.54 |
50.70±3.82 |
|
Whole CCVD, % |
59.61±6.28 |
56.58±7.57 |
61.20±5.65 |
66.00±4.02 |
|
FAZ, mm2 |
0.34±0.17 |
0.37±0.14 |
0.33±0.05 |
0.26±0.11 |
|
PERIM, mm |
2.35±0.63 |
2.25 (2.05, 2.70) |
2.28±0.22 |
2.00 (1.67, 2.29) |
|
The horizontal cross-sectional
scans of OCTA, n (%) |
|
|
|
|
|
Local angiographic form |
14 (87.50) |
15 (83.33) |
0 |
6 (35.29) |
|
Diffuse angiographic form |
2 (12.50) |
3 (16.67) |
16 (100) |
1 (5.88) |
PCV: Polypoidal choroidal
vasculopathy; nv-AMD: Neovascular
age-related macular degeneration; CSC: Central serous chorioretinopathy; SFCT:
Sub-foveal choroidal thickness; PED: Pigment epithelium detachment; OCTA:
Optical coherence tomography angiography; RVD: Retinal vessel density; CCVD:
Choroidal capillary vessel density; FAZ: Fovea avascular zone; PERIM: FAZ
perimeter.
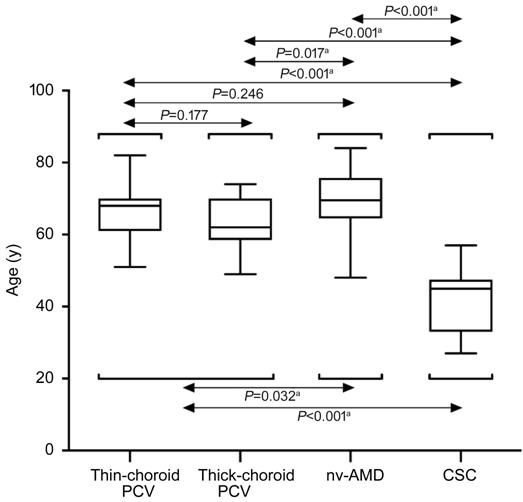
Figure 4 Distribution of age Box plots among thin-choroid PCV,
thick-choroid PCV, nv-AMD and CSC. aP<0.05 was required
for results to be considered statistically significant.
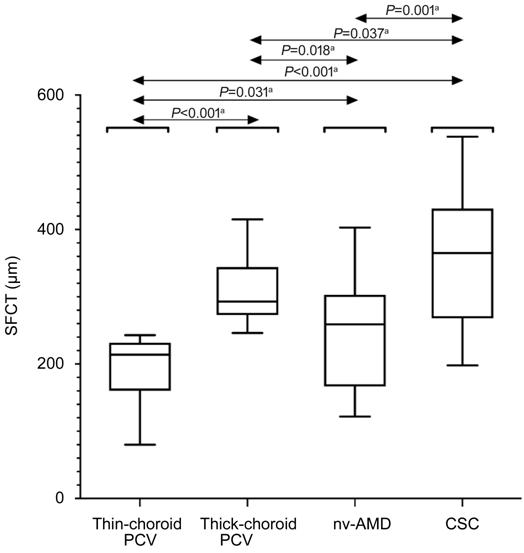
Figure 5 Distribution of SFCT Box plots among thin-choroid PCV,
thick-choroid PCV, nv-AMD and CSC. aP<0.05 was required
for results to be considered statistically significant.
In terms of choroidal morphology,
there was no significant difference in the ratio of thickness of Haller’s layer
to thickness of SFCT between thin-choroid PCV (0.84%±0.06%) and thick-choroid
PCV (0.86%±0.06%; P=0.473), or between thin-choroid PCV and nv-AMD
(0.78%±0.13%; P=0.055), or between nv-AMD and CSC (0.72%±0.11%; P=0.260).
However, the ratio was significantly higher in eyes with thin-choroid PCV
compared with CSC (P<0.001). Likewise, thick-choroid PCV had
significantly higher ratio than nv-AMD (P=0.016) or CSC (P<0.001;
Table 1, Figure 6).
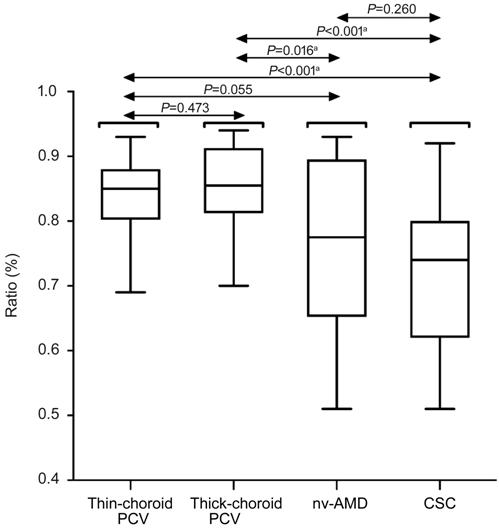
Figure 6 Distribution of the ratio
of Haller’s layer thickness to SFCT
Box plots
among thin-choroid PCV, thick-choroid PCV, nv-AMD and CSC. aP<0.05
was required for results to be considered statistically significant.
We also researched the PEDs subtypes
of different groups in our study. There were 4 patients having only one subtype
of PEDs in thin-choroid PCV, 7 patients having only one subtype of PEDs in
thick-choroid PCV, 3 patients having only one subtype of PEDs in nv-AMD, 12
patients having only one subtype of PEDs in CSC, respectively. Other patients
in these four groups had at least two subtypes of PEDs. Drusenoid PED was
associated with nv-AMD (9 eyes, 56.3%), but was occasionally observed in
thin-choroid PCV (3 eyes, 18.8%), thick-choroid PCV (3 eyes, 16.7%) and CSC (2
eyes, 11.8%). Serous PED was closely related to CSC (15 eyes, 88.2%), followed
by thin-choroid PCV (9 eyes, 56.3%) and thick-choroid PCV (9 eyes, 50%), but
appeared less in nv-AMD (4 eyes, 25%). Peaked PED was a common finding in
nv-AMD (8 eyes, 50%), followed by thick-choroid PCV (5 eyes, 27.8%),
thin-choroid PCV (4 eyes, 25%), and CSC (4 eyes, 23.5%). Flat PED was very
common in thin-choroid PCV (14 eyes, 87.5%) and thick-choroid PCV (17 eyes,
94.4%), followed by nv-AMD (11 eyes, 68.6%), but was less likely to appear in
CSC (2 eyes, 11.8%; Table 1, Figure 7).
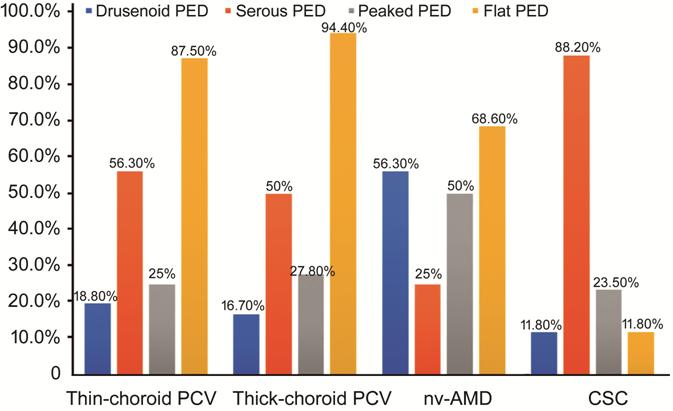
Figure 7 Distribution of each PED
subtype among thin-choroid PCV, thick-choroid PCV, nv-AMD and CSC.
In addition, we also tested some
quantitative data in OCTA. The whole-superficial RVD in CSC (50.60%±2.87%) was
higher compared to other three groups (all P<0.05). The
whole-superficial RVD was significantly higher in eyes with thin-choroid PCV
(46.05%±4.43%) compared with nv-AMD (41.84%±4.40%; P=0.029). However,
the difference in the whole-superficial RVD between thick-choroid PCV
(43.67%±3.73%) and thin-choroid PCV (P=0.192), or between thick-choroid
PCV and nv-AMD (P=0.225) was neither statistically significant. Besides,
the whole-deep RVD in CSC (50.70%±3.82%) was higher compared to other three
groups (all P<0.05). But there was no significant difference in the
whole-deep RVD between thin-choroid PCV (45.86%±3.62%) and thick-choroid PCV
(44.43%±5.26%; P=0.675), or between thin-choroid PCV and nv-AMD
(43.85%±4.54%; P=0.141), or between thick-choroid PCV and nv-AMD (P=0.377).
As for the whole CCVD, it was significantly higher in eyes with CSC
(66.00%±4.02%) compared with other three groups (all P<0.05). What’s
more, the whole CCVD in nv-AMD (61.20%±5.65%) was higher compared to
thick-choroid PCV (56.58%±7.57%; P=0.032). But there was no significant
difference in the whole CCVD between thin-choroid PCV (59.61%±6.28%) and
thick-choroid PCV (P=0.275), or between thin-choroid PCV and nv-AMD (P=0.220).
Detailed data can be found in the Table 1 and Figure 8. FAZ in CSC (0.26±
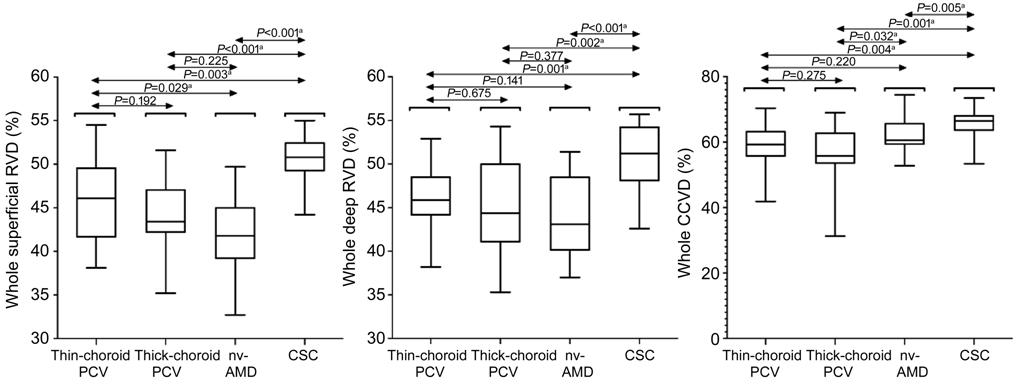
Figure 8 Distribution of the whole
superficial RVD, deep RVD and CCVD Box plots among thin-choroid PCV,
thick-choroid PCV, nv-AMD and CSC.
aP<0.01 was required for results to be considered
statistically significant.
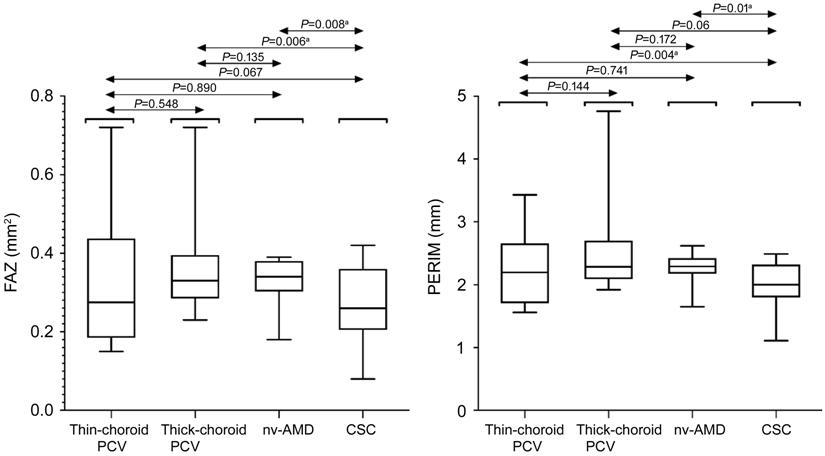
Figure 9 Distributions of FAZ and
PERIM Box plots among thin-choroid PCV,
thick-choroid PCV, nv-AMD and CSC. aP<0.01 was required
for results to be considered statistically significant.
Comparison of the horizontal
cross-sectional scans of OCTA showed cross-sectional local angiographic form
was 87.50%, 83.33%, 0 and 35.29% in thin-choroid PCV, thick-choroid PCV, nv-AMD
and CSC, respectively. Of which, there were 5 PCV patients and 1 CSC patient
having cluster cross-sectional local angiographic form, 1 PCV patient having
both nodular and cluster cross-sectional local angiographic form, others having
nodular cross-sectional local angiographic form. And morphology was
“cross-sectional diffuse angiographic form” was 12.50%, 16.67%, 100% and 5.88%
in thin-choroid PCV, thick-choroid PCV, nv-AMD and CSC, respectively (Table 1
and Figure 10).
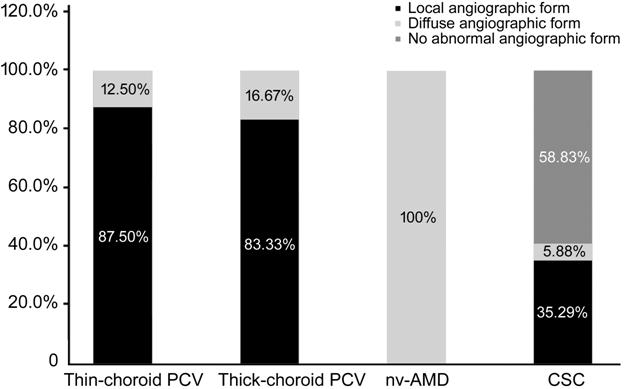
Figure 10 Distribution of different
horizontal cross-sectional scans of OCTA among thin-choroid PCV, thick-choroid
PCV, nv-AMD and CSC.
As for the correlation analysis, we
analyzed the correlation between SFCT and whole superficial RVD, whole deep
RVD, whole CCVD, respectively. We also analyzed the correlation between the
ratio of thickness of Haller’s layer to thickness of SFCT and whole superficial
RVD, whole deep RVD, whole CCVD, respectively. The results showed that the
correlations were not statistically significant in all these groups (all P>0.05).
Detailed data can be found in Figures 11, 12.
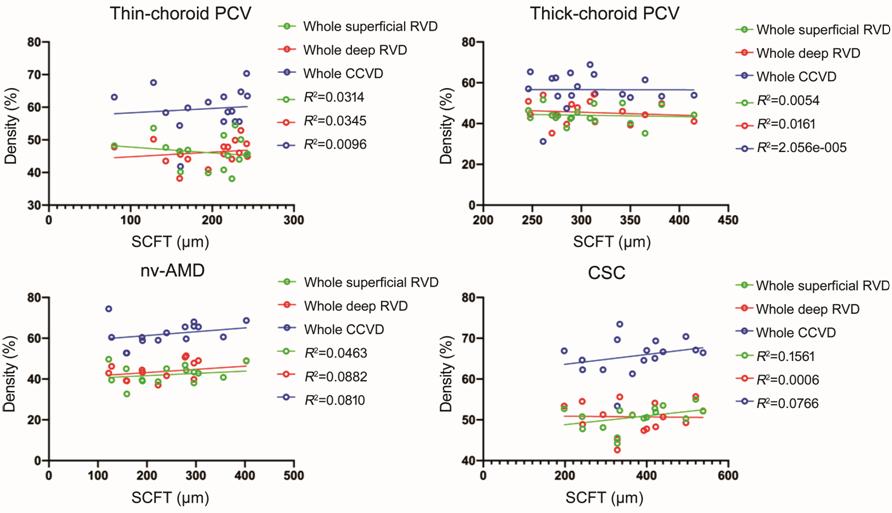
Figure 11 Relationship between
vascular density and SFCT Scatter plot showing the correlation
was not statistically significant in all these four groups (all P>0.05).
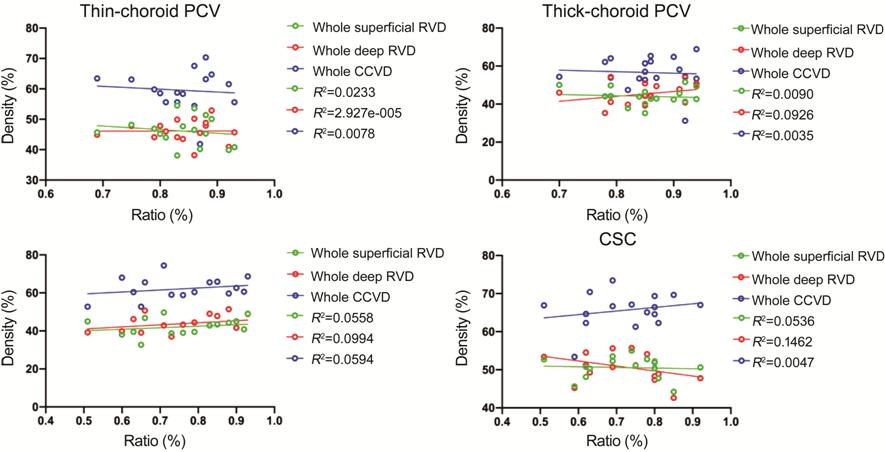
Figure 12 Relationship between
vascular density and the ratio of Haller’s layer to SFCT Scatter plot showing the correlation
was not statistically significant in all these four groups (all P>0.05).
DISCUSSION
In our study, we compared the
qualitative and quantitative characteristics among PCV, nv-AMD and CSC by OCT
and OCTA. First, the results showed that SFCT in CSC was thicker compared to
other three groups. This result is consistent with previous studies which
suggest that pachychoroid pigment epitheliopathy is thought to be a form of CSC[19-20]. Interestingly, we found that
some PCV patients had thicker choroid than nv-AMD, but there were still PCV
patients with thinner choroid than nv-AMD. As for SFCT, some researchers
believed that increased choroidal hyperpermeability caused by choroidal
thickening was important for the pathogenesis of PCV, which suggested that the
choroidal vascular lesion seen in PCV may have a significant structural
difference in the choroid compared to nv-AMD[21-22]. However, our study found that not all SFCT in
patients with PCV were thicker than nv-AMD. There are two points in our
analysis. First, there are many factors affecting choroidal thickness, such as
age, gender, axial length, and systemic diseases[23-25], which will affect the measurement and comparison of
choroidal thickness. Secondly, as choroidal thickening could increase choroidal
hyperpermeability, we consider SFCT of patients with PCV may be related to the
severity or duration of disease, which may explain that not all patients with
PCV have the characteristic of choroidal thickening. Therefore, the research on
the role of SFCT in PCV and nv-AMD remains to be further studied. In addition
to SFCT, Haller vessel dilatation with choriocapillaris attenuation in these diseases
has aroused extensive concentration. Recently, one study found that diffuse
homogeneous Haller’s vessel dilatation accompanied with choriocapillaris
attenuation was identified around the disease foci in CSC, which was similar to
those seen in PCV with thick choroid[9]. What’s
more, another study said that dilation of large choroidal vessels were more
commonly seen in PCV patients than nv-AMD[26]. In
our study, we analyzed the ratio of thickness of Haller’s layer to thickness of
SFCT among these four groups. The result showed the ratio of Haller’s layer to
thickness of SFCT from high to low was thick PCV, thin PCV, CSC and nv-AMD,
which was not exactly the same as the previous studies. For this result, we
speculated that dilated Haller’s layer vessels appeared more often in PCV
patients and CSC patients, supporting the theory that PCV may be one of the
pachychoroid spectrum disorders and should be distinguished from nv-AMD.
With the development of OCT
technology, we could use this technology to segment and quantify RPE
elevations. Currently, PED subtypes are generally classified into drusenoid
PEDs, Serous PEDs, vascularized PEDs and mix PEDs[14].
Drusenoid PED is characterized by displacement of RPE away from BM and are
homogenous and internal drusen reflectance[27-28]. In our study, drusenoid PED was mostly associated
with nv-AMD, but was occasionally observed in thin-choroid PCV, thick-choroid
PCV and CSC. This result indicated that drusenoid PED could be a recognized
phenotypic manifestation of AMD, which is similar to previous studies[29-31]. Serous PED was first described
by Gass[32] and was known as well-defined,
dome-shaped RPE elevations with low internal reflectance and properly good
visualization of the underlying BM and choroid. The height and length of serous
PED fluctuate from tens of micrometers to several millimeters, and there are
different types of forms, including round, oval, horseshoe-shaped[19,33-34]. In our
research, serous PED was closely related to CSC, followed by thin-choroid PCV and
thick-choroid PCV, but appeared less in nv-AMD. Based on this result, we
suggested that serous PED may be a prominent characteristic of CSC and it may
play an important role in evaluating the severity and progression of
chorioretinal impairment. And secondly, we found that PCV frequently
accompanied highly reflective materials within the serous PED beneath the outer
surface of the RPE, which indicated the presence of neovascularization (Figure
3). According to previous studies, vascularized PEDs were characteristic of
heterogenous internal reflectance in the high or shallow RPE elevations. Peaked
PEDs were defined as PEDs with a high peak or a steep angle with a relatively
normal contour; those PEDs with a shallow peak and irregular shape were
categorized as “flat” PEDs[35]. Owing to our
study, we found that peaked PED was a common finding in nv-AMD followed by
thin-choroid PCV, thick-choroid PCV and CSC. Flat PED was very common in
thin-choroid PCV and thick-choroid PCV, followed by nv-AMD, but was less likely
to appear in CSC. This suggested that although both PCV and nv-AMD had CNV,
their development process and manifestations were not exactly the same.
However, the specific mechanism remains to be further studied.
As for vascular density, the
whole-superficial RVD, deep RVD and CCVD were all significantly higher in eyes
with CSC compared with other groups, which was consistent with those of a
previous study by Baek et al[9]. Besides,
FAZ in CSC was significantly smaller compared to thick choroid and nv-AMD, and
PERIM in CSC was significantly shorter compared to thin-choroid PCV and nv-AMD.
These results suggested that the CNV of PCV and nv-AMD might share a similar
pathophysiology associated with decreased vascular density. However, there was
a difference on the whole CCVD indicator between PCV and nv-AMD, like, the
whole CCVD in nv-AMD was significantly higher compared to thick-choroid PCV,
but not higher than thin-choroid PCV. This result corresponded to the ratio of
thickness of Haller’s layer to thickness of SFCT among thin-choroid PCV,
thick-choroid PCV and nv-AMD. Based on these results, we believed that there
was continuous expansion of Haller’s layer vessels and gradual choriocapillaris
attenuation with the progress of PCV, which didn’t exist in nv-AMD. On the
above basis, we analyzed the correlation between SFCT and whole superior RVD,
whole deep RVD, whole CCVD, respectively, and also studied the correlation
between the ratio of thickness of Haller’s layer to thickness of SFCT and whole
superior RVD, whole deep RVD, whole CCVD, respectively. The results showed that
the correlations were not statistically significant in all these groups, which
wasn’t exactly the same as a previous study by Baek et al[9]. For this result, there were two possible reasons, one
of which may be that our two methods of calculating vascular density were
different. Another was that there was sample selection difference between us.
Therefore, the research on the correlation between vascular density and SFCT,
or the ratio of thickness of Haller’s layer to thickness of SFCT remains to be
further studied.
In addition to this, we compared the
horizontal cross-sectional scans of OCTA among them, which showed OCTA can
detect vascular network in the majority of cases with PCV and nv-AMD, but there
were differences between them. Cross-sectional local angiographic form was
commonly in PCV, including cluster cross-sectional local angiographic form and
nodular cross-sectional local angiographic form; however, cross-sectional
diffuse angiographic form was commonly in nv-AMD. Combine the analysis of ICGA,
we believed the above local cross-sectional local angiographic form represented
the polypoidal lesions in PCV, which was consistent with other research results[36-39]. Therefore, OCTA combined with
cross-sectional OCT could provide more comprehensive picture of PCV, which may
help ophthalmologists to generate prompt diagnosis of PCV, and provided
ophthalmologists a good way to distinguish between PCV and nv-AMD.
There are several limitations our
study. The sample size was relatively small. And owing to the differences in
age between study groups, we did not include a normal population as controls.
Besides, our subjects were all from the Chinese population, as well as we did
not measure axial length of study eyes. In addition to this, the research
indicators we selected are more cumbersome, therefore, in the future research,
we will conduct in-depth research and analysis on the more meaningful
indicators in the results of this article.
All in all, combination of OCT and
OCTA can effectively observe the significant alterations in retinal and
choroidal manifestations existed in PCV, CSC and nv-AMD, and there are
distinctive differences among them. Besides, there is gradual thickening of the
choroid, continuous expansion of Haller’s layer vessels and gradual
choriocapillaris attenuation with the progress of PCV, which didn’t exist in
CSC or nv-AMD. Also, compared with CSC and nv-AMD, PCV has the unique
characteristic of cross-sectional local angiographic form on OCTA. Therefore,
we can’t simply think that the pathophysiology of PCV and nv-AMD is similar, or
PCV and CSC shared a similar pathophysiology. We believe this study will
improve deeper understanding of the pathogenesis of PCV and provide a more
reasonable diagnosis and treatment plan for PCV.
ACKNOWLEDGEMENTS
Thanks to Peking Union Medical
College Hospital for providing me with a good learning environment. I am
grateful to Prof. Chen YX for giving me the opportunity to study for a doctor.
Thank you for the cooperation and support from every patient. Finally, thanks
to the encouragement and companionship of parents and husband.
Foundation: Supported by National Natural
Science Foundation of China (No.81670879).
Conflicts of Interest: Yuan MZ, None; Chen LL, None; Yang
JY, None; Luo MY, None; Chen YX, None.
REFERENCES